|
Download Data (XLS File) |
|
||||||||
|
||||||||
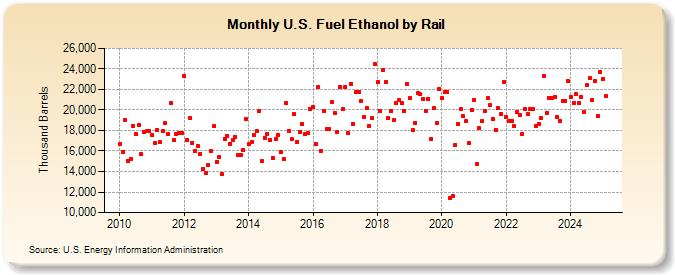
| U.S. Fuel Ethanol by Rail (Thousand Barrels) | ||||||||
| Year | Jan | Feb | Mar | Apr | May | Jun | Jul | Aug | Sep | Oct | Nov | Dec |
|---|---|---|---|---|---|---|---|---|---|---|---|---|
| 2010 | 16,688 | 15,872 | 19,061 | 15,060 | 15,265 | 18,426 | 17,660 | 18,512 | 15,660 | 17,837 | 17,901 | 17,918 |
| 2011 | 17,575 | 16,805 | 18,015 | 16,844 | 17,920 | 18,683 | 17,686 | 20,693 | 17,043 | 17,643 | 17,712 | 17,800 |
| 2012 | 23,336 | 17,113 | 19,169 | 16,788 | 16,035 | 16,504 | 15,745 | 14,283 | 13,852 | 14,670 | 16,030 | 18,392 |
| 2013 | 14,957 | 15,409 | 13,716 | 17,207 | 17,487 | 16,720 | 17,070 | 17,370 | 15,624 | 15,597 | 16,088 | 19,089 |
| 2014 | 16,662 | 16,832 | 17,545 | 17,905 | 19,915 | 15,001 | 17,294 | 17,687 | 17,103 | 15,337 | 17,196 | 17,566 |
| 2015 | 15,885 | 15,209 | 20,664 | 17,931 | 17,121 | 19,633 | 16,891 | 17,887 | 18,620 | 17,664 | 17,721 | 20,130 |
| 2016 | 20,251 | 16,636 | 22,233 | 16,000 | 19,866 | 18,186 | 18,117 | 20,768 | 19,694 | 17,875 | 22,262 | 20,050 |
| 2017 | 22,249 | 17,716 | 22,558 | 18,676 | 21,763 | 21,712 | 20,843 | 19,282 | 20,157 | 18,475 | 19,260 | 24,459 |
| 2018 | 22,738 | 19,850 | 23,900 | 22,709 | 19,220 | 19,886 | 18,976 | 20,635 | 20,968 | 20,650 | 19,938 | 22,483 |
| 2019 | 21,157 | 18,025 | 18,751 | 21,630 | 21,521 | 21,055 | 19,901 | 21,059 | 17,163 | 20,150 | 18,761 | 22,043 |
| 2020 | 21,153 | 21,702 | 21,779 | 11,387 | 11,567 | 16,607 | 18,649 | 20,048 | 19,365 | 18,877 | 16,818 | 19,971 |
| 2021 | 20,998 | 14,693 | 18,234 | 18,922 | 19,889 | 21,161 | 20,453 | 19,113 | 18,074 | 20,152 | 19,594 | 22,730 |
| 2022 | 19,314 | 18,910 | 18,934 | 18,404 | 19,773 | 19,461 | 17,641 | 20,111 | 19,589 | 20,047 | 20,103 | 18,410 |
| 2023 | 18,621 | 19,240 | 23,286 | 19,712 | 21,212 | 21,120 | 21,311 | 19,343 | 18,949 | 20,825 | 20,875 | 22,487 |
| 2024 | 21,239 | |||||||||||
| - = No Data Reported; -- = Not Applicable; NA = Not Available; W = Withheld to avoid disclosure of individual company data. |
| Release Date: 3/29/2024 |
| Next Release Date: 4/30/2024 |
Referring Pages: