|
Download Data (XLS File) |
|
||||||||
|
||||||||
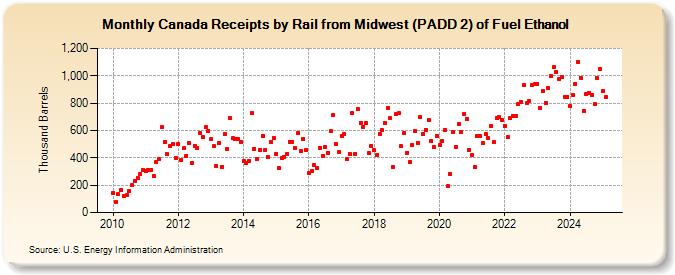
| Canada Receipts by Rail from Midwest (PADD 2) of Fuel Ethanol (Thousand Barrels) | ||||||||
| Year | Jan | Feb | Mar | Apr | May | Jun | Jul | Aug | Sep | Oct | Nov | Dec |
|---|---|---|---|---|---|---|---|---|---|---|---|---|
| 2010 | 143 | 79 | 133 | 166 | 121 | 125 | 157 | 198 | 234 | 253 | 279 | 314 |
| 2011 | 301 | 313 | 313 | 268 | 366 | 390 | 624 | 518 | 426 | 488 | 498 | 400 |
| 2012 | 501 | 384 | 469 | 413 | 508 | 362 | 489 | 471 | 582 | 553 | 623 | 596 |
| 2013 | 541 | 483 | 342 | 507 | 336 | 573 | 466 | 692 | 542 | 539 | 541 | 516 |
| 2014 | 376 | 361 | 379 | 728 | 468 | 390 | 458 | 562 | 458 | 405 | 519 | 545 |
| 2015 | 427 | 323 | 398 | 409 | 430 | 519 | 518 | 474 | 581 | 449 | 536 | 458 |
| 2016 | 292 | 301 | 346 | 323 | 472 | 416 | 479 | 439 | 593 | 715 | 503 | 442 |
| 2017 | 556 | 573 | 390 | 430 | 725 | 430 | 755 | 655 | 629 | 657 | 435 | 487 |
| 2018 | 455 | 424 | 572 | 600 | 653 | 764 | 688 | 335 | 718 | 725 | 483 | 584 |
| 2019 | 439 | 372 | 494 | 598 | 511 | 700 | 574 | 607 | 676 | 524 | 479 | 562 |
| 2020 | 491 | 526 | 607 | 192 | 281 | 586 | 482 | 649 | 589 | 724 | 687 | 456 |
| 2021 | 422 | 331 | 563 | 560 | 508 | 577 | 544 | 630 | 514 | 691 | 695 | 676 |
| 2022 | 634 | 550 | 691 | 709 | 705 | 792 | 809 | 931 | 798 | 815 | 933 | 939 |
| 2023 | 941 | 766 | 888 | 801 | 912 | 999 | 1,061 | 1,027 | 976 | 990 | 843 | 847 |
| 2024 | 847 | |||||||||||
| - = No Data Reported; -- = Not Applicable; NA = Not Available; W = Withheld to avoid disclosure of individual company data. |
| Release Date: 3/29/2024 |
| Next Release Date: 4/30/2024 |
Referring Pages: