|
Download Data (XLS File) |
|
||||||||
|
||||||||
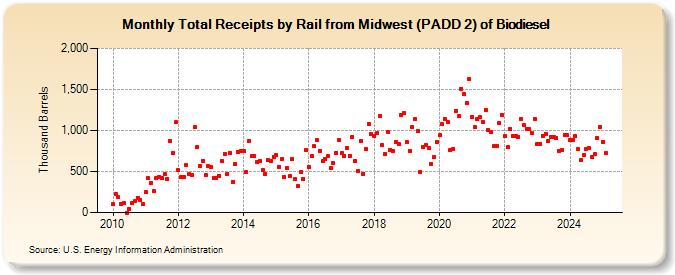
| Total Receipts by Rail from Midwest (PADD 2) of Biodiesel (Thousand Barrels) | ||||||||
| Year | Jan | Feb | Mar | Apr | May | Jun | Jul | Aug | Sep | Oct | Nov | Dec |
|---|---|---|---|---|---|---|---|---|---|---|---|---|
| 2010 | 101 | 227 | 184 | 109 | 114 | 0 | 46 | 114 | 137 | 181 | 152 | 99 |
| 2011 | 248 | 417 | 366 | 262 | 417 | 438 | 422 | 468 | 408 | 871 | 725 | 1,098 |
| 2012 | 514 | 435 | 436 | 576 | 473 | 461 | 1,038 | 799 | 563 | 634 | 462 | 565 |
| 2013 | 558 | 427 | 425 | 450 | 632 | 719 | 470 | 731 | 376 | 597 | 741 | 747 |
| 2014 | 748 | 493 | 872 | 687 | 689 | 619 | 623 | 522 | 467 | 638 | 624 | 681 |
| 2015 | 700 | 557 | 651 | 431 | 544 | 440 | 648 | 407 | 321 | 489 | 407 | 757 |
| 2016 | 556 | 685 | 806 | 882 | 745 | 624 | 651 | 684 | 541 | 601 | 729 | 886 |
| 2017 | 725 | 691 | 789 | 695 | 925 | 634 | 509 | 872 | 475 | 769 | 1,080 | 954 |
| 2018 | 931 | 966 | 1,181 | 818 | 715 | 980 | 767 | 752 | 864 | 839 | 1,187 | 1,210 |
| 2019 | 855 | 752 | 1,042 | 1,142 | 996 | 493 | 804 | 824 | 791 | 595 | 679 | 854 |
| 2020 | 940 | 1,076 | 1,145 | 1,102 | 761 | 773 | 1,236 | 1,173 | 1,509 | 1,439 | 1,337 | 1,622 |
| 2021 | 1,168 | 1,038 | 1,135 | 1,158 | 1,082 | 1,242 | 1,006 | 980 | 806 | 812 | 1,093 | 1,190 |
| 2022 | 933 | 796 | 1,024 | 938 | 927 | 924 | 1,145 | 1,062 | 1,022 | 1,012 | 968 | 1,143 |
| 2023 | 834 | 837 | 934 | 963 | 868 | 925 | 911 | 904 | 754 | 763 | 940 | 930 |
| 2024 | 885 | |||||||||||
| - = No Data Reported; -- = Not Applicable; NA = Not Available; W = Withheld to avoid disclosure of individual company data. |
| Release Date: 3/29/2024 |
| Next Release Date: 4/30/2024 |
Referring Pages: