|
Download Data (XLS File) |
|
||||||||
|
||||||||
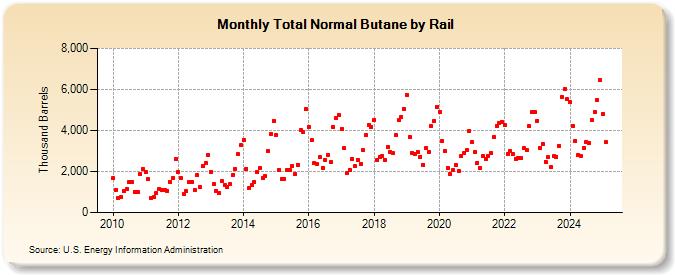
| Total Normal Butane by Rail (Thousand Barrels) | ||||||||
| Year | Jan | Feb | Mar | Apr | May | Jun | Jul | Aug | Sep | Oct | Nov | Dec |
|---|---|---|---|---|---|---|---|---|---|---|---|---|
| 2010 | 1,679 | 1,107 | 704 | 754 | 1,053 | 1,172 | 1,489 | 1,489 | 1,016 | 1,000 | 1,868 | 2,130 |
| 2011 | 1,955 | 1,629 | 703 | 755 | 952 | 1,171 | 1,081 | 1,085 | 1,063 | 1,504 | 1,676 | 2,609 |
| 2012 | 1,991 | 1,696 | 896 | 1,028 | 1,481 | 1,501 | 1,121 | 1,817 | 1,224 | 2,263 | 2,401 | 2,801 |
| 2013 | 1,993 | 1,402 | 1,062 | 951 | 1,514 | 1,362 | 1,242 | 1,373 | 1,849 | 2,125 | 2,832 | 3,273 |
| 2014 | 3,555 | 2,141 | 1,176 | 1,334 | 1,500 | 1,975 | 2,167 | 1,680 | 1,764 | 2,982 | 3,848 | 4,482 |
| 2015 | 3,787 | 2,090 | 1,640 | 1,648 | 2,063 | 2,084 | 2,286 | 1,887 | 2,331 | 4,000 | 3,911 | 5,055 |
| 2016 | 4,179 | 3,534 | 2,408 | 2,374 | 2,703 | 2,194 | 2,582 | 2,814 | 2,451 | 4,162 | 4,611 | 4,757 |
| 2017 | 4,087 | 3,130 | 1,908 | 2,093 | 2,598 | 2,256 | 2,585 | 2,362 | 3,032 | 3,778 | 4,278 | 4,178 |
| 2018 | 4,531 | 2,580 | 2,722 | 2,759 | 2,581 | 3,199 | 2,960 | 2,885 | 3,774 | 4,490 | 4,665 | 5,061 |
| 2019 | 5,748 | 3,686 | 2,925 | 2,855 | 2,966 | 2,728 | 2,336 | 3,145 | 2,960 | 4,212 | 4,471 | 5,166 |
| 2020 | 4,906 | 3,497 | 3,022 | 2,180 | 1,863 | 2,073 | 2,311 | 2,046 | 2,752 | 2,896 | 3,041 | 3,981 |
| 2021 | 3,420 | 2,959 | 2,431 | 2,192 | 2,737 | 2,610 | 2,780 | 2,894 | 3,679 | 4,226 | 4,384 | 4,434 |
| 2022 | 4,274 | 2,843 | 2,987 | 2,836 | 2,621 | 2,679 | 2,659 | 3,122 | 3,042 | 4,228 | 4,877 | 4,896 |
| 2023 | 4,421 | 3,154 | 3,340 | 2,448 | 2,683 | 2,226 | 2,740 | 2,722 | 3,234 | 5,635 | 5,973 | 5,314 |
| 2024 | 4,868 | |||||||||||
| - = No Data Reported; -- = Not Applicable; NA = Not Available; W = Withheld to avoid disclosure of individual company data. |
| Release Date: 3/29/2024 |
| Next Release Date: 4/30/2024 |
Referring Pages: