|
Download Data (XLS File) |
|
||||||||
|
||||||||
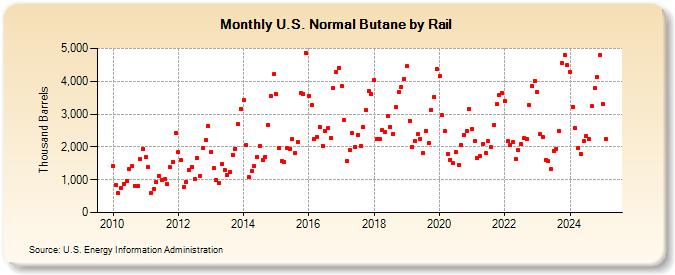
| U.S. Normal Butane by Rail (Thousand Barrels) | ||||||||
| Year | Jan | Feb | Mar | Apr | May | Jun | Jul | Aug | Sep | Oct | Nov | Dec |
|---|---|---|---|---|---|---|---|---|---|---|---|---|
| 2010 | 1,419 | 832 | 581 | 743 | 877 | 970 | 1,331 | 1,433 | 824 | 798 | 1,622 | 1,930 |
| 2011 | 1,684 | 1,378 | 592 | 721 | 921 | 1,115 | 999 | 1,020 | 865 | 1,388 | 1,525 | 2,418 |
| 2012 | 1,830 | 1,597 | 789 | 943 | 1,287 | 1,376 | 1,011 | 1,657 | 1,126 | 1,977 | 2,209 | 2,640 |
| 2013 | 1,848 | 1,350 | 993 | 914 | 1,472 | 1,305 | 1,137 | 1,242 | 1,763 | 1,946 | 2,692 | 3,163 |
| 2014 | 3,419 | 2,056 | 1,080 | 1,260 | 1,416 | 1,699 | 2,037 | 1,596 | 1,701 | 2,671 | 3,545 | 4,208 |
| 2015 | 3,609 | 1,977 | 1,570 | 1,553 | 1,957 | 1,948 | 2,247 | 1,811 | 2,159 | 3,638 | 3,613 | 4,851 |
| 2016 | 3,536 | 3,273 | 2,238 | 2,299 | 2,613 | 2,038 | 2,489 | 2,565 | 2,284 | 3,787 | 4,280 | 4,411 |
| 2017 | 3,851 | 2,829 | 1,560 | 1,904 | 2,420 | 2,005 | 2,375 | 2,032 | 2,598 | 3,128 | 3,701 | 3,607 |
| 2018 | 4,023 | 2,235 | 2,228 | 2,500 | 2,451 | 2,931 | 2,610 | 2,404 | 3,208 | 3,676 | 3,827 | 4,072 |
| 2019 | 4,456 | 2,803 | 2,000 | 2,169 | 2,379 | 2,255 | 1,808 | 2,493 | 2,113 | 3,136 | 3,534 | 4,369 |
| 2020 | 4,148 | 2,959 | 2,487 | 1,787 | 1,616 | 1,498 | 1,832 | 1,457 | 2,055 | 2,348 | 2,488 | 3,168 |
| 2021 | 2,548 | 2,182 | 1,661 | 1,719 | 2,098 | 1,800 | 2,171 | 1,985 | 2,674 | 3,303 | 3,569 | 3,645 |
| 2022 | 3,383 | 2,166 | 2,068 | 2,147 | 1,623 | 1,898 | 2,102 | 2,256 | 2,227 | 3,266 | 3,862 | 4,014 |
| 2023 | 3,612 | 2,380 | 2,301 | 1,565 | 1,556 | 1,324 | 1,886 | 1,950 | 2,464 | 4,555 | 4,754 | 4,295 |
| 2024 | 3,723 | |||||||||||
| - = No Data Reported; -- = Not Applicable; NA = Not Available; W = Withheld to avoid disclosure of individual company data. |
| Release Date: 3/29/2024 |
| Next Release Date: 4/30/2024 |
Referring Pages: