|
Download Data (XLS File) |
|
||||||||
|
||||||||
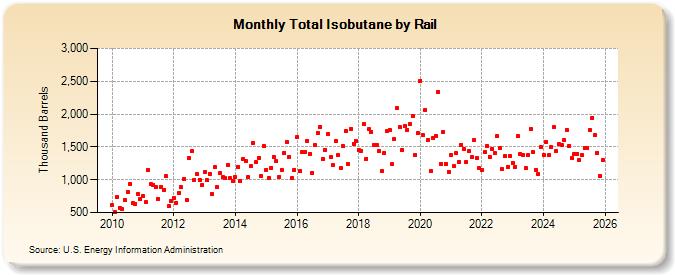
| Total Isobutane by Rail (Thousand Barrels) | ||||||||
| Year | Jan | Feb | Mar | Apr | May | Jun | Jul | Aug | Sep | Oct | Nov | Dec |
|---|---|---|---|---|---|---|---|---|---|---|---|---|
| 2010 | 611 | 506 | 731 | 571 | 548 | 696 | 811 | 937 | 639 | 631 | 783 | 699 |
| 2011 | 748 | 656 | 1,148 | 931 | 927 | 886 | 708 | 896 | 848 | 1,050 | 599 | 670 |
| 2012 | 725 | 646 | 798 | 883 | 1,018 | 697 | 1,334 | 1,431 | 1,003 | 1,082 | 1,001 | 921 |
| 2013 | 1,121 | 990 | 1,091 | 787 | 1,188 | 885 | 1,096 | 1,034 | 1,024 | 1,225 | 1,021 | 985 |
| 2014 | 1,040 | 1,196 | 979 | 1,317 | 1,287 | 1,034 | 1,205 | 1,566 | 1,266 | 1,333 | 1,057 | 1,510 |
| 2015 | 1,154 | 1,023 | 1,185 | 1,348 | 1,281 | 1,049 | 1,153 | 1,414 | 1,572 | 1,348 | 1,026 | 1,154 |
| 2016 | 1,650 | 1,136 | 1,427 | 1,428 | 1,594 | 1,398 | 1,109 | 1,527 | 1,717 | 1,807 | 1,317 | 1,460 |
| 2017 | 1,700 | 1,344 | 1,218 | 1,589 | 1,373 | 1,177 | 1,511 | 1,736 | 1,235 | 1,779 | 1,549 | 1,590 |
| 2018 | 1,453 | 1,441 | 1,842 | 1,320 | 1,765 | 1,731 | 1,527 | 1,533 | 1,438 | 1,134 | 1,411 | 1,737 |
| 2019 | 1,757 | 1,234 | 1,619 | 2,088 | 1,798 | 1,459 | 1,820 | 1,759 | 1,842 | 1,967 | 1,379 | 1,709 |
| 2020 | 2,511 | 1,677 | 2,064 | 1,602 | 1,128 | 1,642 | 1,669 | 2,342 | 1,240 | 1,731 | 1,245 | 1,119 |
| 2021 | 1,384 | 1,202 | 1,403 | 1,271 | 1,536 | 1,465 | 1,272 | 1,433 | 1,340 | 1,600 | 1,334 | 1,177 |
| 2022 | 1,152 | 1,419 | 1,511 | 1,349 | 1,466 | 1,409 | 1,662 | 1,476 | 1,163 | 1,356 | 1,200 | 1,358 |
| 2023 | 1,260 | 1,199 | 1,668 | 1,400 | 1,389 | 1,179 | 1,387 | 1,779 | 1,421 | 1,151 | 1,094 | 1,311 |
| 2024 | 1,365 | |||||||||||
| - = No Data Reported; -- = Not Applicable; NA = Not Available; W = Withheld to avoid disclosure of individual company data. |
| Release Date: 3/29/2024 |
| Next Release Date: 4/30/2024 |
Referring Pages: