|
Download Data (XLS File) |
|
||||||||
|
||||||||
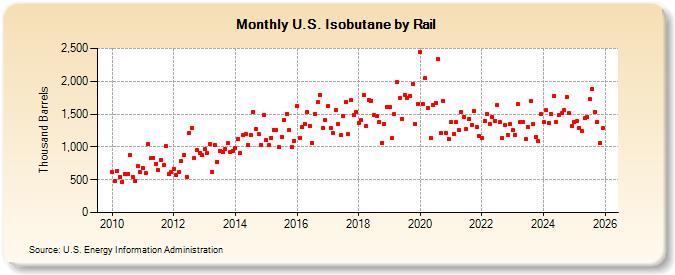
| U.S. Isobutane by Rail (Thousand Barrels) | ||||||||
| Year | Jan | Feb | Mar | Apr | May | Jun | Jul | Aug | Sep | Oct | Nov | Dec |
|---|---|---|---|---|---|---|---|---|---|---|---|---|
| 2010 | 611 | 483 | 637 | 540 | 470 | 587 | 583 | 882 | 547 | 481 | 709 | 611 |
| 2011 | 678 | 600 | 1,042 | 824 | 837 | 746 | 646 | 805 | 723 | 1,013 | 585 | 611 |
| 2012 | 667 | 577 | 611 | 788 | 876 | 545 | 1,213 | 1,292 | 833 | 952 | 903 | 871 |
| 2013 | 966 | 907 | 1,039 | 624 | 1,032 | 777 | 944 | 921 | 971 | 1,054 | 917 | 945 |
| 2014 | 977 | 1,127 | 908 | 1,178 | 1,197 | 1,034 | 1,177 | 1,538 | 1,266 | 1,193 | 1,029 | 1,482 |
| 2015 | 1,098 | 1,023 | 1,139 | 1,264 | 1,253 | 993 | 1,153 | 1,414 | 1,503 | 1,258 | 1,002 | 1,095 |
| 2016 | 1,622 | 1,132 | 1,303 | 1,355 | 1,525 | 1,317 | 1,053 | 1,502 | 1,679 | 1,786 | 1,295 | 1,405 |
| 2017 | 1,622 | 1,292 | 1,212 | 1,556 | 1,341 | 1,174 | 1,478 | 1,680 | 1,191 | 1,717 | 1,484 | 1,530 |
| 2018 | 1,368 | 1,402 | 1,791 | 1,319 | 1,715 | 1,703 | 1,482 | 1,477 | 1,377 | 1,062 | 1,345 | 1,614 |
| 2019 | 1,610 | 1,139 | 1,496 | 1,987 | 1,748 | 1,432 | 1,795 | 1,747 | 1,779 | 1,954 | 1,352 | 1,653 |
| 2020 | 2,445 | 1,656 | 2,044 | 1,596 | 1,128 | 1,642 | 1,669 | 2,332 | 1,205 | 1,701 | 1,214 | 1,119 |
| 2021 | 1,384 | 1,196 | 1,381 | 1,255 | 1,524 | 1,461 | 1,272 | 1,429 | 1,340 | 1,551 | 1,305 | 1,163 |
| 2022 | 1,134 | 1,396 | 1,504 | 1,349 | 1,460 | 1,399 | 1,641 | 1,380 | 1,141 | 1,328 | 1,188 | 1,351 |
| 2023 | 1,253 | 1,186 | 1,652 | 1,380 | 1,389 | 1,116 | 1,314 | 1,698 | 1,353 | 1,148 | 1,090 | 1,311 |
| 2024 | 1,358 | |||||||||||
| - = No Data Reported; -- = Not Applicable; NA = Not Available; W = Withheld to avoid disclosure of individual company data. |
| Release Date: 3/29/2024 |
| Next Release Date: 4/30/2024 |
Referring Pages: