|
Download Data (XLS File) |
|
||||||||
|
||||||||
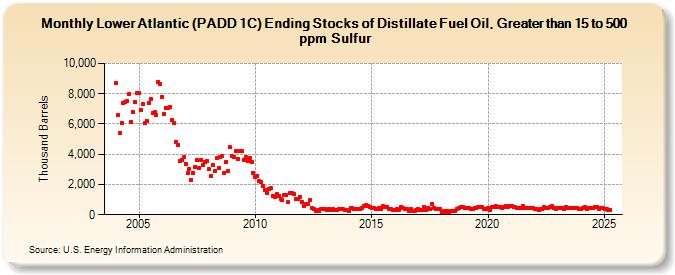
| Lower Atlantic (PADD 1C) Ending Stocks of Distillate Fuel Oil, Greater than 15 to 500 ppm Sulfur (Thousand Barrels) | ||||||||
| Year | Jan | Feb | Mar | Apr | May | Jun | Jul | Aug | Sep | Oct | Nov | Dec |
|---|---|---|---|---|---|---|---|---|---|---|---|---|
| 2004 | 8,692 | 6,582 | 5,399 | 6,066 | 7,389 | 7,470 | 7,516 | 8,000 | 6,132 | 6,821 | 7,438 | 8,030 |
| 2005 | 8,059 | 6,931 | 7,316 | 6,062 | 6,207 | 7,418 | 7,626 | 6,716 | 6,784 | 6,585 | 8,789 | 8,637 |
| 2006 | 7,794 | 6,643 | 7,064 | 7,048 | 7,106 | 6,256 | 6,068 | 4,814 | 4,639 | 3,520 | 3,641 | 3,798 |
| 2007 | 3,373 | 2,748 | 3,051 | 2,328 | 2,791 | 3,181 | 3,589 | 3,063 | 3,647 | 3,295 | 3,491 | 3,519 |
| 2008 | 3,003 | 2,556 | 3,277 | 2,878 | 3,720 | 3,099 | 3,807 | 3,862 | 2,769 | 3,483 | 2,901 | 4,446 |
| 2009 | 3,869 | 3,808 | 4,228 | 3,688 | 4,219 | 4,192 | 3,644 | 3,797 | 3,568 | 3,759 | 3,513 | 2,786 |
| 2010 | 2,479 | 2,563 | 2,236 | 2,166 | 1,886 | 1,626 | 1,427 | 1,701 | 1,739 | 1,212 | 1,174 | 1,353 |
| 2011 | 1,205 | 1,056 | 971 | 1,271 | 1,290 | 832 | 1,418 | 1,413 | 1,384 | 1,051 | 1,059 | 1,195 |
| 2012 | 837 | 598 | 718 | 737 | 948 | 453 | 388 | 259 | 296 | 238 | 396 | 378 |
| 2013 | 358 | 339 | 358 | 333 | 370 | 323 | 344 | 380 | 357 | 347 | 303 | 338 |
| 2014 | 238 | 454 | 453 | 366 | 399 | 373 | 397 | 420 | 599 | 644 | 585 | 540 |
| 2015 | 476 | 426 | 368 | 352 | 452 | 408 | 560 | 530 | 539 | 388 | 356 | 311 |
| 2016 | 293 | 363 | 298 | 500 | 414 | 378 | 408 | 270 | 348 | 254 | 247 | 295 |
| 2017 | 394 | 308 | 318 | 540 | 343 | 443 | 345 | 728 | 440 | 349 | 394 | 405 |
| 2018 | 209 | 237 | 200 | 278 | 174 | 260 | 259 | 267 | 401 | 463 | 493 | 543 |
| 2019 | 443 | 477 | 449 | 401 | 366 | 430 | 437 | 527 | 482 | 490 | 397 | 382 |
| 2020 | 460 | 311 | 532 | 514 | 573 | 530 | 502 | 474 | 527 | 547 | 491 | 566 |
| 2021 | 545 | 493 | 523 | 429 | 444 | 472 | 544 | 450 | 464 | 474 | 428 | 438 |
| 2022 | 393 | 394 | 310 | 393 | 394 | 479 | 471 | 460 | 491 | 566 | 473 | 362 |
| 2023 | 441 | 417 | 451 | 406 | 520 | 418 | 432 | 476 | 435 | 446 | 460 | 379 |
| 2024 | 406 | |||||||||||
| - = No Data Reported; -- = Not Applicable; NA = Not Available; W = Withheld to avoid disclosure of individual company data. |
| Release Date: 3/29/2024 |
| Next Release Date: 4/30/2024 |