|
Download Data (XLS File) |
|
||||||||
|
||||||||
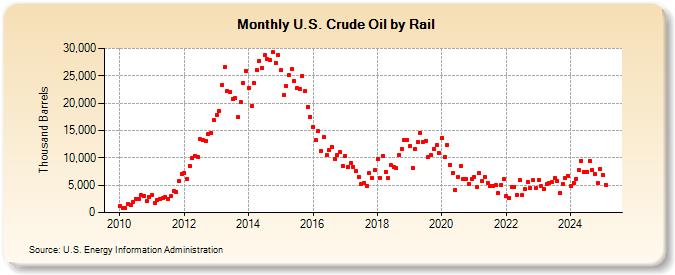
| U.S. Crude Oil by Rail (Thousand Barrels) | ||||||||
| Year | Jan | Feb | Mar | Apr | May | Jun | Jul | Aug | Sep | Oct | Nov | Dec |
|---|---|---|---|---|---|---|---|---|---|---|---|---|
| 2010 | 1,215 | 776 | 747 | 1,525 | 1,410 | 1,901 | 2,499 | 2,536 | 3,145 | 3,027 | 2,108 | 2,821 |
| 2011 | 3,163 | 1,713 | 2,323 | 2,504 | 2,704 | 2,903 | 2,476 | 2,955 | 3,980 | 3,790 | 5,765 | 7,096 |
| 2012 | 7,299 | 6,102 | 8,556 | 9,892 | 10,422 | 10,165 | 13,393 | 13,205 | 13,080 | 14,391 | 14,559 | 16,961 |
| 2013 | 17,815 | 18,526 | 23,277 | 26,535 | 22,187 | 22,101 | 20,722 | 20,850 | 17,395 | 20,230 | 23,681 | 25,876 |
| 2014 | 22,798 | 19,477 | 23,714 | 26,068 | 27,707 | 26,491 | 28,715 | 28,011 | 27,870 | 29,268 | 27,394 | 28,764 |
| 2015 | 25,988 | 21,506 | 23,140 | 25,050 | 26,255 | 24,048 | 22,738 | 22,502 | 24,977 | 22,200 | 19,293 | 17,522 |
| 2016 | 15,661 | 13,187 | 14,843 | 11,331 | 13,735 | 10,480 | 11,517 | 12,003 | 9,732 | 10,586 | 10,979 | 8,533 |
| 2017 | 10,379 | 8,351 | 9,090 | 8,382 | 7,519 | 6,546 | 5,247 | 5,481 | 4,866 | 7,171 | 6,268 | 7,754 |
| 2018 | 9,872 | 6,284 | 10,423 | 7,479 | 6,259 | 8,605 | 8,259 | 8,124 | 10,512 | 11,649 | 13,227 | 13,311 |
| 2019 | 12,100 | 8,163 | 11,643 | 12,918 | 14,587 | 12,971 | 13,133 | 10,174 | 10,518 | 11,685 | 12,267 | 10,857 |
| 2020 | 13,678 | 10,167 | 12,355 | 8,747 | 7,311 | 4,125 | 6,509 | 8,431 | 6,066 | 6,126 | 5,229 | 6,100 |
| 2021 | 6,499 | 4,654 | 7,205 | 5,685 | 6,501 | 5,409 | 4,814 | 4,785 | 5,008 | 3,488 | 4,979 | 6,043 |
| 2022 | 3,039 | 2,625 | 4,707 | 4,669 | 3,299 | 5,908 | 3,122 | 4,229 | 5,669 | 4,515 | 5,890 | 4,408 |
| 2023 | 5,933 | 4,787 | 4,289 | 5,204 | 5,370 | 5,539 | 6,293 | 5,844 | 3,647 | 5,191 | 6,362 | 6,722 |
| 2024 | 4,348 | |||||||||||
| - = No Data Reported; -- = Not Applicable; NA = Not Available; W = Withheld to avoid disclosure of individual company data. |
| Release Date: 3/29/2024 |
| Next Release Date: 4/30/2024 |
Referring Pages: