|
Download Data (XLS File) |
|
||||||||||
|
||||||||||
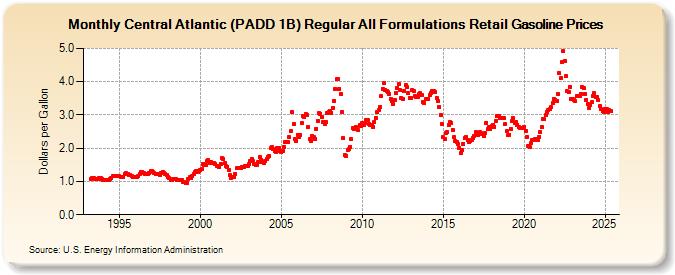
| Central Atlantic (PADD 1B) Regular All Formulations Retail Gasoline Prices (Dollars per Gallon) | ||||||||||
| Year | Jan | Feb | Mar | Apr | May | Jun | Jul | Aug | Sep | Oct | Nov | Dec |
|---|---|---|---|---|---|---|---|---|---|---|---|---|
| 1993 | 1.074 | 1.092 | 1.096 | 1.088 | 1.074 | 1.061 | 1.102 | 1.090 | 1.061 | |||
| 1994 | 1.036 | 1.038 | 1.033 | 1.033 | 1.056 | 1.088 | 1.114 | 1.158 | 1.160 | 1.151 | 1.175 | 1.176 |
| 1995 | 1.156 | 1.136 | 1.123 | 1.133 | 1.209 | 1.243 | 1.227 | 1.198 | 1.181 | 1.155 | 1.119 | 1.127 |
| 1996 | 1.142 | 1.133 | 1.151 | 1.232 | 1.299 | 1.284 | 1.255 | 1.230 | 1.221 | 1.227 | 1.264 | 1.302 |
| 1997 | 1.305 | 1.290 | 1.252 | 1.221 | 1.220 | 1.223 | 1.205 | 1.254 | 1.292 | 1.257 | 1.219 | 1.181 |
| 1998 | 1.141 | 1.090 | 1.043 | 1.050 | 1.067 | 1.074 | 1.066 | 1.049 | 1.032 | 1.044 | 1.029 | 0.988 |
| 1999 | 0.971 | 0.946 | 0.966 | 1.084 | 1.120 | 1.118 | 1.156 | 1.227 | 1.274 | 1.303 | 1.299 | 1.323 |
| 2000 | 1.330 | 1.379 | 1.531 | 1.505 | 1.495 | 1.602 | 1.631 | 1.567 | 1.579 | 1.563 | 1.557 | 1.517 |
| 2001 | 1.478 | 1.471 | 1.432 | 1.529 | 1.695 | 1.678 | 1.545 | 1.453 | 1.445 | 1.331 | 1.194 | 1.108 |
| 2002 | 1.131 | 1.131 | 1.225 | 1.396 | 1.412 | 1.398 | 1.401 | 1.428 | 1.434 | 1.453 | 1.464 | 1.463 |
| 2003 | 1.512 | 1.625 | 1.674 | 1.611 | 1.530 | 1.487 | 1.505 | 1.595 | 1.739 | 1.655 | 1.587 | 1.547 |
| 2004 | 1.605 | 1.672 | 1.739 | 1.770 | 1.991 | 2.043 | 1.965 | 1.925 | 1.895 | 2.011 | 2.011 | 1.914 |
| 2005 | 1.876 | 1.919 | 2.037 | 2.200 | 2.172 | 2.176 | 2.327 | 2.505 | 3.074 | 2.721 | 2.289 | 2.229 |
| 2006 | 2.408 | 2.346 | 2.407 | 2.759 | 2.977 | 2.936 | 3.027 | 3.002 | 2.642 | 2.275 | 2.230 | 2.360 |
| 2007 | 2.323 | 2.270 | 2.585 | 2.825 | 3.045 | 3.037 | 2.948 | 2.782 | 2.732 | 2.775 | 3.069 | 3.082 |
| 2008 | 3.117 | 3.066 | 3.219 | 3.424 | 3.785 | 4.074 | 4.076 | 3.793 | 3.619 | 3.089 | 2.301 | 1.788 |
| 2009 | 1.767 | 1.939 | 1.961 | 2.045 | 2.266 | 2.613 | 2.568 | 2.645 | 2.590 | 2.539 | 2.689 | 2.652 |
| 2010 | 2.746 | 2.694 | 2.764 | 2.833 | 2.862 | 2.729 | 2.710 | 2.695 | 2.629 | 2.800 | 2.920 | 3.078 |
| 2011 | 3.154 | 3.234 | 3.556 | 3.785 | 3.947 | 3.743 | 3.705 | 3.686 | 3.634 | 3.487 | 3.424 | 3.324 |
| 2012 | 3.458 | 3.654 | 3.821 | 3.931 | 3.736 | 3.508 | 3.487 | 3.723 | 3.886 | 3.832 | 3.658 | 3.519 |
| 2013 | 3.512 | 3.744 | 3.731 | 3.579 | 3.527 | 3.540 | 3.629 | 3.650 | 3.596 | 3.393 | 3.349 | 3.464 |
| 2014 | 3.485 | 3.480 | 3.587 | 3.657 | 3.722 | 3.720 | 3.682 | 3.514 | 3.424 | 3.244 | 3.011 | 2.741 |
| 2015 | 2.326 | 2.284 | 2.458 | 2.489 | 2.707 | 2.777 | 2.759 | 2.559 | 2.323 | 2.219 | 2.197 | 2.129 |
| 2016 | 2.014 | 1.845 | 1.937 | 2.133 | 2.299 | 2.338 | 2.252 | 2.173 | 2.220 | 2.260 | 2.308 | 2.374 |
| 2017 | 2.492 | 2.418 | 2.382 | 2.474 | 2.460 | 2.412 | 2.372 | 2.448 | 2.769 | 2.581 | 2.637 | 2.583 |
| 2018 | 2.662 | 2.706 | 2.651 | 2.811 | 2.971 | 2.956 | 2.920 | 2.918 | 2.918 | 2.899 | 2.718 | 2.506 |
| 2019 | 2.391 | 2.407 | 2.585 | 2.807 | 2.901 | 2.771 | 2.802 | 2.712 | 2.625 | 2.605 | 2.616 | 2.604 |
| 2020 | 2.638 | 2.526 | 2.349 | 2.061 | 2.027 | 2.162 | 2.248 | 2.253 | 2.278 | 2.276 | 2.255 | 2.337 |
| 2021 | 2.472 | 2.625 | 2.869 | 2.863 | 3.005 | 3.084 | 3.150 | 3.180 | 3.230 | 3.363 | 3.491 | 3.444 |
| 2022 | 3.420 | 3.632 | 4.256 | 4.105 | 4.588 | 4.921 | 4.622 | 4.175 | 3.710 | 3.702 | 3.851 | 3.472 |
| 2023 | 3.469 | 3.458 | 3.406 | 3.554 | 3.573 | 3.572 | 3.627 | 3.836 | 3.797 | 3.643 | 3.461 | 3.328 |
| 2024 | 3.209 | 3.287 | 3.383 | 3.570 | 3.651 | 3.548 | 3.548 | 3.451 | ||||
| - = No Data Reported; -- = Not Applicable; NA = Not Available; W = Withheld to avoid disclosure of individual company data. |
| Release Date: 9/16/2024 |
| Next Release Date: 9/23/2024 |