|
Download Data (XLS File) |
|
||||||||||
|
||||||||||
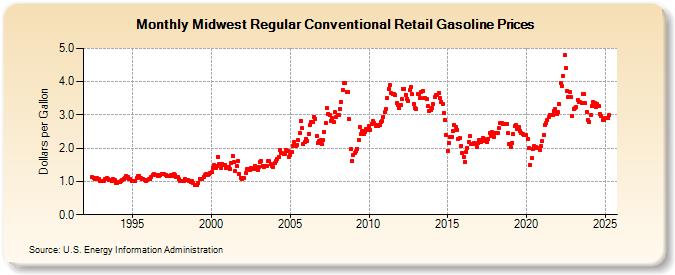
| Midwest Regular Conventional Retail Gasoline Prices (Dollars per Gallon) | ||||||||||
| Year | Jan | Feb | Mar | Apr | May | Jun | Jul | Aug | Sep | Oct | Nov | Dec |
|---|---|---|---|---|---|---|---|---|---|---|---|---|
| 1992 | NA | 1.135 | 1.102 | 1.083 | 1.098 | 1.090 | 1.079 | 1.028 | ||||
| 1993 | 1.016 | 1.018 | 1.026 | 1.071 | 1.095 | 1.083 | 1.050 | 1.032 | 1.019 | 1.070 | 1.038 | 0.965 |
| 1994 | 0.966 | 0.987 | 0.986 | 1.016 | 1.039 | 1.075 | 1.106 | 1.166 | 1.135 | 1.084 | 1.076 | 1.014 |
| 1995 | 1.014 | 1.014 | 1.027 | 1.091 | 1.154 | 1.158 | 1.099 | 1.074 | 1.069 | 1.035 | 1.017 | 1.041 |
| 1996 | 1.066 | 1.066 | 1.127 | 1.206 | 1.224 | 1.202 | 1.179 | 1.164 | 1.178 | 1.187 | 1.236 | 1.228 |
| 1997 | 1.221 | 1.199 | 1.158 | 1.151 | 1.176 | 1.185 | 1.159 | 1.219 | 1.192 | 1.141 | 1.119 | 1.070 |
| 1998 | 1.018 | 1.008 | 1.002 | 1.018 | 1.059 | 1.058 | 1.056 | 1.012 | 0.996 | 1.004 | 0.963 | 0.893 |
| 1999 | 0.900 | 0.880 | 0.963 | 1.085 | 1.085 | 1.085 | 1.128 | 1.183 | 1.236 | 1.202 | 1.232 | 1.250 |
| 2000 | 1.287 | 1.402 | 1.489 | 1.390 | 1.457 | 1.747 | 1.510 | 1.395 | 1.537 | 1.506 | 1.498 | 1.401 |
| 2001 | 1.448 | 1.433 | 1.372 | 1.559 | 1.768 | 1.573 | 1.301 | 1.460 | 1.615 | 1.232 | 1.118 | 1.079 |
| 2002 | 1.096 | 1.094 | 1.251 | 1.369 | 1.360 | 1.353 | 1.394 | 1.367 | 1.375 | 1.465 | 1.385 | 1.338 |
| 2003 | 1.431 | 1.596 | 1.622 | 1.474 | 1.431 | 1.464 | 1.473 | 1.601 | 1.602 | 1.516 | 1.469 | 1.426 |
| 2004 | 1.552 | 1.609 | 1.674 | 1.745 | 1.945 | 1.863 | 1.845 | 1.838 | 1.831 | 1.940 | 1.901 | 1.743 |
| 2005 | 1.806 | 1.885 | 2.075 | 2.180 | 2.055 | 2.106 | 2.232 | 2.444 | 2.824 | 2.592 | 2.126 | 2.171 |
| 2006 | 2.287 | 2.222 | 2.431 | 2.704 | 2.786 | 2.792 | 2.945 | 2.891 | 2.366 | 2.149 | 2.201 | 2.251 |
| 2007 | 2.116 | 2.250 | 2.488 | 2.761 | 3.205 | 3.037 | 2.987 | 2.813 | 2.905 | 2.781 | 3.075 | 2.952 |
| 2008 | 2.992 | 3.004 | 3.184 | 3.403 | 3.747 | 3.974 | 3.962 | 3.702 | 3.697 | 2.876 | 1.973 | 1.625 |
| 2009 | 1.804 | 1.856 | 1.920 | 1.986 | 2.248 | 2.627 | 2.433 | 2.530 | 2.427 | 2.488 | 2.586 | 2.532 |
| 2010 | 2.657 | 2.552 | 2.716 | 2.803 | 2.754 | 2.672 | 2.688 | 2.667 | 2.704 | 2.776 | 2.818 | 2.949 |
| 2011 | 3.073 | 3.169 | 3.506 | 3.784 | 3.888 | 3.644 | 3.640 | 3.628 | 3.591 | 3.358 | 3.284 | 3.197 |
| 2012 | 3.312 | 3.467 | 3.787 | 3.790 | 3.613 | 3.491 | 3.417 | 3.746 | 3.836 | 3.616 | 3.338 | 3.218 |
| 2013 | 3.189 | 3.629 | 3.638 | 3.501 | 3.699 | 3.713 | 3.501 | 3.503 | 3.489 | 3.259 | 3.131 | 3.136 |
| 2014 | 3.206 | 3.314 | 3.527 | 3.593 | 3.586 | 3.666 | 3.495 | 3.394 | 3.335 | 3.063 | 2.857 | 2.394 |
| 2015 | 1.929 | 2.161 | 2.330 | 2.330 | 2.531 | 2.691 | 2.651 | 2.550 | 2.276 | 2.303 | 2.069 | 1.863 |
| 2016 | 1.743 | 1.594 | 1.896 | 2.008 | 2.198 | 2.361 | 2.132 | 2.129 | 2.141 | 2.133 | 2.021 | 2.169 |
| 2017 | 2.259 | 2.186 | 2.212 | 2.316 | 2.262 | 2.219 | 2.191 | 2.273 | 2.468 | 2.376 | 2.475 | 2.350 |
| 2018 | 2.459 | 2.442 | 2.460 | 2.600 | 2.766 | 2.755 | 2.742 | 2.733 | 2.737 | 2.733 | 2.448 | 2.113 |
| 2019 | 2.024 | 2.168 | 2.422 | 2.667 | 2.687 | 2.575 | 2.630 | 2.509 | 2.460 | 2.438 | 2.405 | 2.402 |
| 2020 | 2.387 | 2.281 | 2.002 | 1.499 | 1.702 | 1.976 | 2.066 | 2.040 | 2.016 | 1.998 | 1.932 | 2.054 |
| 2021 | 2.208 | 2.387 | 2.695 | 2.745 | 2.844 | 2.930 | 2.998 | 2.997 | 3.011 | 3.125 | 3.176 | 3.032 |
| 2022 | 3.079 | 3.318 | 3.971 | 3.855 | 4.185 | 4.787 | 4.410 | 3.727 | 3.529 | 3.679 | 3.525 | 2.968 |
| 2023 | 3.187 | 3.195 | 3.234 | 3.451 | 3.379 | 3.388 | 3.366 | 3.633 | 3.623 | 3.344 | 3.099 | 2.853 |
| 2024 | 2.798 | 3.005 | 3.261 | |||||||||
| - = No Data Reported; -- = Not Applicable; NA = Not Available; W = Withheld to avoid disclosure of individual company data. |
| Release Date: 4/15/2024 |
| Next Release Date: 4/22/2024 |