|
Download Data (XLS File) |
|
||||||||||
|
||||||||||
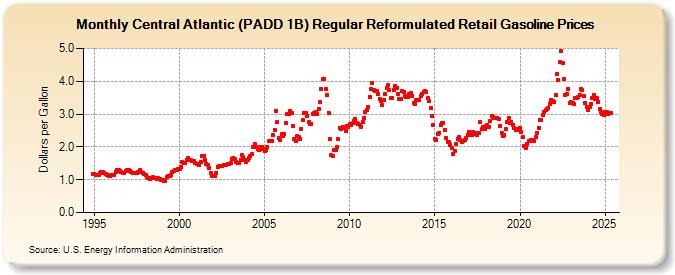
| Central Atlantic (PADD 1B) Regular Reformulated Retail Gasoline Prices (Dollars per Gallon) | ||||||||||
| Year | Jan | Feb | Mar | Apr | May | Jun | Jul | Aug | Sep | Oct | Nov | Dec |
|---|---|---|---|---|---|---|---|---|---|---|---|---|
| 1994 | NA | 1.179 | ||||||||||
| 1995 | 1.169 | 1.158 | 1.146 | 1.147 | 1.209 | 1.241 | 1.226 | 1.195 | 1.176 | 1.149 | 1.116 | 1.118 |
| 1996 | 1.141 | 1.137 | 1.150 | 1.231 | 1.305 | 1.292 | 1.260 | 1.230 | 1.213 | 1.216 | 1.256 | 1.290 |
| 1997 | 1.293 | 1.278 | 1.243 | 1.214 | 1.199 | 1.204 | 1.191 | 1.247 | 1.286 | 1.250 | 1.215 | 1.177 |
| 1998 | 1.137 | 1.090 | 1.039 | 1.033 | 1.051 | 1.068 | 1.064 | 1.048 | 1.033 | 1.041 | 1.028 | 0.999 |
| 1999 | 0.981 | 0.955 | 0.966 | 1.080 | 1.123 | 1.121 | 1.153 | 1.224 | 1.271 | 1.300 | 1.297 | 1.321 |
| 2000 | 1.327 | 1.373 | 1.527 | 1.521 | 1.505 | 1.611 | 1.650 | 1.598 | 1.591 | 1.571 | 1.558 | 1.521 |
| 2001 | 1.483 | 1.473 | 1.443 | 1.535 | 1.723 | 1.723 | 1.600 | 1.490 | 1.453 | 1.349 | 1.206 | 1.105 |
| 2002 | 1.124 | 1.124 | 1.215 | 1.397 | 1.426 | 1.410 | 1.404 | 1.436 | 1.438 | 1.456 | 1.473 | 1.474 |
| 2003 | 1.512 | 1.619 | 1.675 | 1.631 | 1.554 | 1.497 | 1.507 | 1.598 | 1.763 | 1.684 | 1.609 | 1.555 |
| 2004 | 1.598 | 1.662 | 1.729 | 1.769 | 1.992 | 2.081 | 2.001 | 1.946 | 1.894 | 1.995 | 2.009 | 1.922 |
| 2005 | 1.866 | 1.895 | 2.003 | 2.179 | 2.184 | 2.179 | 2.347 | 2.527 | 3.103 | 2.750 | 2.281 | 2.198 |
| 2006 | 2.378 | 2.320 | 2.378 | 2.735 | 3.005 | 3.009 | 3.089 | 3.024 | 2.635 | 2.230 | 2.186 | 2.324 |
| 2007 | 2.294 | 2.239 | 2.550 | 2.811 | 3.047 | 3.039 | 2.945 | 2.758 | 2.685 | 2.708 | 3.006 | 3.034 |
| 2008 | 3.056 | 3.007 | 3.166 | 3.376 | 3.765 | 4.065 | 4.073 | 3.775 | 3.581 | 3.040 | 2.246 | 1.745 |
| 2009 | 1.726 | 1.893 | 1.915 | 1.999 | 2.231 | 2.586 | 2.549 | 2.615 | 2.565 | 2.499 | 2.647 | 2.616 |
| 2010 | 2.707 | 2.667 | 2.723 | 2.797 | 2.854 | 2.724 | 2.706 | 2.677 | 2.608 | 2.769 | 2.894 | 3.050 |
| 2011 | 3.127 | 3.209 | 3.531 | 3.761 | 3.947 | 3.745 | 3.708 | 3.688 | 3.617 | 3.456 | 3.393 | 3.282 |
| 2012 | 3.418 | 3.622 | 3.787 | 3.895 | 3.721 | 3.494 | 3.497 | 3.728 | 3.854 | 3.782 | 3.618 | 3.473 |
| 2013 | 3.459 | 3.703 | 3.687 | 3.536 | 3.519 | 3.534 | 3.624 | 3.640 | 3.565 | 3.346 | 3.307 | 3.428 |
| 2014 | 3.423 | 3.415 | 3.537 | 3.619 | 3.680 | 3.701 | 3.666 | 3.487 | 3.390 | 3.187 | 2.945 | 2.677 |
| 2015 | 2.248 | 2.224 | 2.401 | 2.434 | 2.668 | 2.740 | 2.732 | 2.527 | 2.269 | 2.158 | 2.141 | 2.072 |
| 2016 | 1.956 | 1.788 | 1.885 | 2.076 | 2.247 | 2.290 | 2.212 | 2.136 | 2.183 | 2.210 | 2.279 | 2.359 |
| 2017 | 2.461 | 2.389 | 2.352 | 2.443 | 2.424 | 2.390 | 2.354 | 2.430 | 2.757 | 2.542 | 2.602 | 2.542 |
| 2018 | 2.630 | 2.671 | 2.617 | 2.781 | 2.952 | 2.921 | 2.882 | 2.877 | 2.866 | 2.845 | 2.638 | 2.433 |
| 2019 | 2.343 | 2.353 | 2.534 | 2.766 | 2.872 | 2.736 | 2.764 | 2.672 | 2.562 | 2.529 | 2.548 | 2.520 |
| 2020 | 2.562 | 2.444 | 2.292 | 2.029 | 1.978 | 2.096 | 2.178 | 2.184 | 2.198 | 2.205 | 2.179 | 2.288 |
| 2021 | 2.433 | 2.581 | 2.830 | 2.820 | 2.981 | 3.049 | 3.113 | 3.139 | 3.184 | 3.312 | 3.436 | 3.391 |
| 2022 | 3.357 | 3.588 | 4.210 | 4.042 | 4.579 | 4.921 | 4.568 | 4.067 | 3.567 | 3.611 | 3.773 | 3.325 |
| 2023 | 3.369 | 3.330 | 3.303 | 3.491 | 3.503 | 3.515 | 3.586 | 3.778 | 3.731 | 3.540 | 3.351 | 3.230 |
| 2024 | 3.126 | 3.207 | 3.296 | 3.496 | 3.589 | 3.466 | 3.483 | 3.364 | ||||
| - = No Data Reported; -- = Not Applicable; NA = Not Available; W = Withheld to avoid disclosure of individual company data. |
| Release Date: 9/16/2024 |
| Next Release Date: 9/23/2024 |