|
Download Data (XLS File) |
|
||||||||||
|
||||||||||
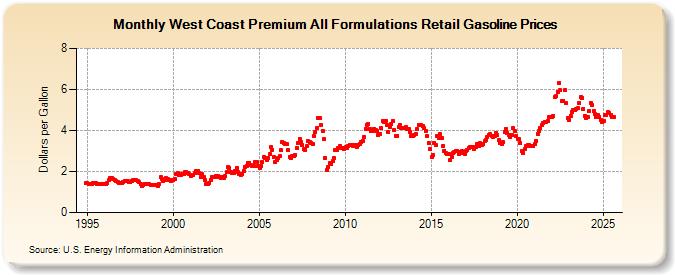
| West Coast Premium All Formulations Retail Gasoline Prices (Dollars per Gallon) | ||||||||||
| Year | Jan | Feb | Mar | Apr | May | Jun | Jul | Aug | Sep | Oct | Nov | Dec |
|---|---|---|---|---|---|---|---|---|---|---|---|---|
| 1994 | NA | 1.431 | ||||||||||
| 1995 | 1.426 | 1.405 | 1.392 | 1.404 | 1.438 | 1.444 | 1.427 | 1.402 | 1.391 | 1.397 | 1.385 | 1.376 |
| 1996 | 1.381 | 1.387 | 1.428 | 1.563 | 1.689 | 1.663 | 1.623 | 1.572 | 1.523 | 1.484 | 1.434 | 1.420 |
| 1997 | 1.458 | 1.496 | 1.521 | 1.561 | 1.543 | 1.508 | 1.472 | 1.523 | 1.607 | 1.602 | 1.568 | 1.523 |
| 1998 | 1.471 | 1.389 | 1.300 | 1.327 | 1.408 | 1.403 | 1.387 | 1.368 | 1.356 | 1.355 | 1.351 | 1.342 |
| 1999 | 1.327 | 1.308 | 1.404 | 1.728 | 1.635 | 1.533 | 1.589 | 1.676 | 1.622 | 1.582 | 1.561 | 1.580 |
| 2000 | 1.569 | 1.634 | 1.891 | 1.911 | 1.832 | 1.810 | 1.880 | 1.861 | 1.976 | 1.976 | 1.941 | 1.872 |
| 2001 | 1.792 | 1.810 | 1.850 | 1.916 | 2.034 | 2.040 | 1.912 | 1.752 | 1.856 | 1.755 | 1.583 | 1.392 |
| 2002 | 1.398 | 1.454 | 1.604 | 1.754 | 1.736 | 1.751 | 1.769 | 1.761 | 1.749 | 1.708 | 1.736 | 1.706 |
| 2003 | 1.768 | 1.955 | 2.228 | 2.172 | 1.995 | 1.931 | 1.916 | 2.041 | 2.182 | 1.970 | 1.886 | 1.833 |
| 2004 | 1.871 | 2.035 | 2.241 | 2.290 | 2.431 | 2.439 | 2.339 | 2.255 | 2.253 | 2.464 | 2.441 | 2.257 |
| 2005 | 2.150 | 2.285 | 2.461 | 2.706 | 2.647 | 2.543 | 2.678 | 2.843 | 3.177 | 3.061 | 2.704 | 2.467 |
| 2006 | 2.560 | 2.655 | 2.737 | 3.035 | 3.439 | 3.369 | 3.354 | 3.321 | 3.064 | 2.730 | 2.656 | 2.734 |
| 2007 | 2.754 | 2.795 | 3.148 | 3.411 | 3.588 | 3.454 | 3.290 | 3.082 | 3.065 | 3.223 | 3.487 | 3.454 |
| 2008 | 3.407 | 3.358 | 3.707 | 3.920 | 4.113 | 4.603 | 4.603 | 4.256 | 3.992 | 3.574 | 2.681 | 2.060 |
| 2009 | 2.200 | 2.401 | 2.390 | 2.494 | 2.648 | 3.072 | 3.044 | 3.163 | 3.252 | 3.140 | 3.129 | 3.094 |
| 2010 | 3.178 | 3.123 | 3.232 | 3.285 | 3.277 | 3.258 | 3.292 | 3.310 | 3.203 | 3.271 | 3.330 | 3.419 |
| 2011 | 3.507 | 3.684 | 4.084 | 4.285 | 4.324 | 4.092 | 3.970 | 3.954 | 4.085 | 4.013 | 3.964 | 3.775 |
| 2012 | 3.849 | 4.100 | 4.469 | 4.411 | 4.449 | 4.252 | 3.937 | 4.179 | 4.307 | 4.483 | 4.005 | 3.745 |
| 2013 | 3.755 | 4.167 | 4.274 | 4.126 | 4.144 | 4.144 | 4.164 | 4.054 | 4.073 | 3.923 | 3.747 | 3.738 |
| 2014 | 3.767 | 3.819 | 4.051 | 4.255 | 4.283 | 4.261 | 4.228 | 4.104 | 3.969 | 3.726 | 3.396 | 3.075 |
| 2015 | 2.710 | 2.817 | 3.374 | 3.281 | 3.753 | 3.636 | 3.810 | 3.626 | 3.249 | 3.020 | 2.908 | 2.855 |
| 2016 | 2.873 | 2.554 | 2.729 | 2.886 | 2.949 | 3.023 | 3.016 | 2.863 | 2.932 | 2.978 | 2.924 | 2.873 |
| 2017 | 2.981 | 3.056 | 3.158 | 3.182 | 3.210 | 3.188 | 3.118 | 3.178 | 3.321 | 3.246 | 3.374 | 3.289 |
| 2018 | 3.345 | 3.464 | 3.530 | 3.691 | 3.801 | 3.806 | 3.751 | 3.699 | 3.722 | 3.867 | 3.758 | 3.515 |
| 2019 | 3.367 | 3.344 | 3.436 | 3.934 | 4.085 | 3.881 | 3.759 | 3.661 | 3.756 | 4.098 | 3.986 | 3.712 |
| 2020 | 3.602 | 3.569 | 3.393 | 2.978 | 2.919 | 3.103 | 3.226 | 3.274 | 3.282 | 3.241 | 3.221 | 3.239 |
| 2021 | 3.338 | 3.497 | 3.852 | 3.984 | 4.133 | 4.247 | 4.345 | 4.417 | 4.407 | 4.482 | 4.645 | 4.633 |
| 2022 | 4.642 | 4.722 | 5.632 | 5.670 | 5.878 | 6.324 | 5.959 | 5.443 | 5.455 | 5.956 | 5.321 | 4.607 |
| 2023 | 4.526 | 4.726 | 4.914 | 4.982 | 5.000 | 5.052 | 5.075 | 5.330 | 5.629 | 5.600 | 5.061 | 4.712 |
| 2024 | 4.610 | 4.635 | 4.936 | 5.354 | 5.252 | 4.941 | 4.781 | 4.658 | ||||
| - = No Data Reported; -- = Not Applicable; NA = Not Available; W = Withheld to avoid disclosure of individual company data. |
| Release Date: 9/16/2024 |
| Next Release Date: 9/23/2024 |