|
Download Data (XLS File) |
|
||||||||||
|
||||||||||
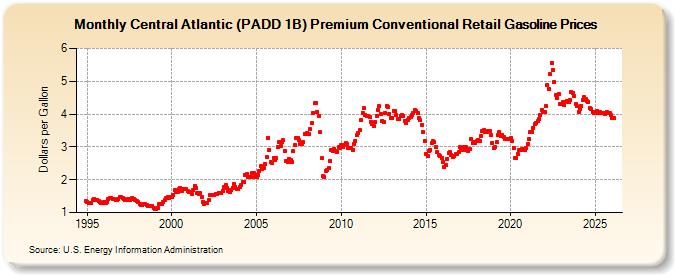
| Central Atlantic (PADD 1B) Premium Conventional Retail Gasoline Prices (Dollars per Gallon) | ||||||||||
| Year | Jan | Feb | Mar | Apr | May | Jun | Jul | Aug | Sep | Oct | Nov | Dec |
|---|---|---|---|---|---|---|---|---|---|---|---|---|
| 1994 | NA | 1.350 | ||||||||||
| 1995 | 1.325 | 1.298 | 1.282 | 1.299 | 1.383 | 1.415 | 1.396 | 1.368 | 1.349 | 1.322 | 1.290 | 1.303 |
| 1996 | 1.314 | 1.304 | 1.325 | 1.401 | 1.458 | 1.445 | 1.421 | 1.398 | 1.390 | 1.392 | 1.426 | 1.460 |
| 1997 | 1.463 | 1.452 | 1.414 | 1.385 | 1.395 | 1.398 | 1.380 | 1.421 | 1.454 | 1.423 | 1.389 | 1.354 |
| 1998 | 1.311 | 1.261 | 1.219 | 1.231 | 1.254 | 1.263 | 1.237 | 1.214 | 1.198 | 1.214 | 1.200 | 1.138 |
| 1999 | 1.122 | 1.106 | 1.139 | 1.255 | 1.275 | 1.269 | 1.320 | 1.388 | 1.432 | 1.462 | 1.457 | 1.476 |
| 2000 | 1.477 | 1.532 | 1.679 | 1.616 | 1.621 | 1.730 | 1.745 | 1.662 | 1.708 | 1.705 | 1.709 | 1.668 |
| 2001 | 1.636 | 1.635 | 1.576 | 1.688 | 1.806 | 1.759 | 1.609 | 1.558 | 1.595 | 1.463 | 1.331 | 1.271 |
| 2002 | 1.303 | 1.302 | 1.394 | 1.543 | 1.538 | 1.527 | 1.546 | 1.569 | 1.580 | 1.603 | 1.598 | 1.595 |
| 2003 | 1.666 | 1.792 | 1.833 | 1.735 | 1.644 | 1.640 | 1.672 | 1.759 | 1.867 | 1.784 | 1.728 | 1.711 |
| 2004 | 1.784 | 1.854 | 1.917 | 1.938 | 2.151 | 2.163 | 2.092 | 2.070 | 2.077 | 2.215 | 2.201 | 2.090 |
| 2005 | 2.084 | 2.142 | 2.271 | 2.415 | 2.341 | 2.360 | 2.485 | 2.681 | 3.283 | 2.904 | 2.525 | 2.497 |
| 2006 | 2.674 | 2.600 | 2.660 | 3.008 | 3.142 | 3.033 | 3.149 | 3.203 | 2.888 | 2.570 | 2.529 | 2.641 |
| 2007 | 2.594 | 2.549 | 2.865 | 3.065 | 3.271 | 3.268 | 3.202 | 3.096 | 3.081 | 3.144 | 3.397 | 3.397 |
| 2008 | 3.437 | 3.389 | 3.530 | 3.735 | 4.047 | 4.331 | 4.331 | 4.067 | 3.936 | 3.439 | 2.647 | 2.121 |
| 2009 | 2.077 | 2.251 | 2.284 | 2.361 | 2.568 | 2.903 | 2.865 | 2.936 | 2.881 | 2.857 | 3.003 | 2.962 |
| 2010 | 3.045 | 2.987 | 3.050 | 3.112 | 3.103 | 2.979 | 2.953 | 2.955 | 2.902 | 3.081 | 3.191 | 3.348 |
| 2011 | 3.429 | 3.502 | 3.823 | 4.047 | 4.186 | 3.985 | 3.943 | 3.930 | 3.899 | 3.768 | 3.711 | 3.643 |
| 2012 | 3.769 | 3.944 | 4.117 | 4.236 | 4.013 | 3.791 | 3.772 | 4.033 | 4.244 | 4.209 | 4.011 | 3.883 |
| 2013 | 3.892 | 4.095 | 4.102 | 3.957 | 3.845 | 3.847 | 3.943 | 3.972 | 3.954 | 3.789 | 3.735 | 3.827 |
| 2014 | 3.894 | 3.901 | 3.978 | 4.031 | 4.117 | 4.081 | 4.025 | 3.877 | 3.810 | 3.676 | 3.453 | 3.178 |
| 2015 | 2.787 | 2.724 | 2.890 | 2.920 | 3.105 | 3.174 | 3.139 | 2.995 | 2.835 | 2.757 | 2.713 | 2.657 |
| 2016 | 2.541 | 2.373 | 2.447 | 2.642 | 2.812 | 2.848 | 2.746 | 2.680 | 2.715 | 2.775 | 2.798 | 2.844 |
| 2017 | 2.983 | 2.927 | 2.894 | 2.990 | 2.986 | 2.918 | 2.869 | 2.947 | 3.242 | 3.110 | 3.157 | 3.121 |
| 2018 | 3.176 | 3.222 | 3.169 | 3.331 | 3.485 | 3.505 | 3.466 | 3.468 | 3.488 | 3.486 | 3.355 | 3.129 |
| 2019 | 2.965 | 2.985 | 3.146 | 3.358 | 3.448 | 3.343 | 3.377 | 3.300 | 3.255 | 3.241 | 3.238 | 3.247 |
| 2020 | 3.270 | 3.187 | 2.980 | 2.662 | 2.655 | 2.797 | 2.892 | 2.893 | 2.934 | 2.925 | 2.914 | 2.959 |
| 2021 | 3.075 | 3.229 | 3.465 | 3.454 | 3.588 | 3.682 | 3.742 | 3.786 | 3.847 | 3.980 | 4.120 | 4.062 |
| 2022 | 4.049 | 4.244 | 4.885 | 4.776 | 5.219 | 5.555 | 5.350 | 4.976 | 4.570 | 4.488 | 4.615 | 4.306 |
| 2023 | 4.311 | 4.367 | 4.264 | 4.376 | 4.404 | 4.360 | 4.422 | 4.659 | 4.636 | 4.539 | 4.307 | 4.233 |
| 2024 | 4.058 | 4.157 | 4.249 | |||||||||
| - = No Data Reported; -- = Not Applicable; NA = Not Available; W = Withheld to avoid disclosure of individual company data. |
| Release Date: 4/15/2024 |
| Next Release Date: 4/22/2024 |