|
Download Data (XLS File) |
|
||||||||||
|
||||||||||
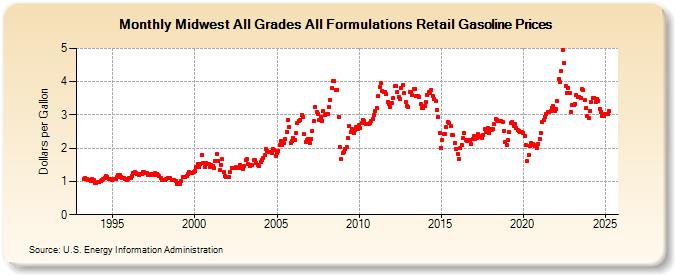
| Midwest All Grades All Formulations Retail Gasoline Prices (Dollars per Gallon) | ||||||||||
| Year | Jan | Feb | Mar | Apr | May | Jun | Jul | Aug | Sep | Oct | Nov | Dec |
|---|---|---|---|---|---|---|---|---|---|---|---|---|
| 1993 | 1.071 | 1.095 | 1.083 | 1.050 | 1.032 | 1.019 | 1.070 | 1.038 | 0.965 | |||
| 1994 | 0.966 | 0.987 | 0.986 | 1.016 | 1.039 | 1.075 | 1.106 | 1.166 | 1.135 | 1.084 | 1.079 | 1.052 |
| 1995 | 1.061 | 1.059 | 1.067 | 1.131 | 1.197 | 1.202 | 1.143 | 1.116 | 1.112 | 1.078 | 1.058 | 1.085 |
| 1996 | 1.110 | 1.108 | 1.170 | 1.247 | 1.273 | 1.244 | 1.223 | 1.205 | 1.218 | 1.228 | 1.280 | 1.273 |
| 1997 | 1.265 | 1.243 | 1.200 | 1.191 | 1.217 | 1.225 | 1.199 | 1.258 | 1.232 | 1.180 | 1.159 | 1.111 |
| 1998 | 1.058 | 1.048 | 1.041 | 1.060 | 1.101 | 1.098 | 1.094 | 1.049 | 1.034 | 1.041 | 1.001 | 0.934 |
| 1999 | 0.942 | 0.919 | 1.002 | 1.125 | 1.127 | 1.124 | 1.167 | 1.220 | 1.277 | 1.240 | 1.269 | 1.287 |
| 2000 | 1.323 | 1.437 | 1.523 | 1.433 | 1.522 | 1.807 | 1.543 | 1.421 | 1.566 | 1.536 | 1.531 | 1.433 |
| 2001 | 1.486 | 1.467 | 1.404 | 1.611 | 1.818 | 1.619 | 1.340 | 1.502 | 1.661 | 1.281 | 1.160 | 1.119 |
| 2002 | 1.129 | 1.126 | 1.289 | 1.412 | 1.410 | 1.402 | 1.432 | 1.409 | 1.418 | 1.506 | 1.423 | 1.377 |
| 2003 | 1.470 | 1.635 | 1.662 | 1.516 | 1.470 | 1.500 | 1.509 | 1.634 | 1.640 | 1.554 | 1.508 | 1.463 |
| 2004 | 1.590 | 1.648 | 1.709 | 1.783 | 1.984 | 1.901 | 1.881 | 1.873 | 1.867 | 1.979 | 1.938 | 1.778 |
| 2005 | 1.841 | 1.918 | 2.109 | 2.219 | 2.096 | 2.142 | 2.273 | 2.487 | 2.862 | 2.638 | 2.168 | 2.207 |
| 2006 | 2.321 | 2.253 | 2.465 | 2.744 | 2.828 | 2.841 | 2.999 | 2.941 | 2.425 | 2.190 | 2.236 | 2.288 |
| 2007 | 2.157 | 2.287 | 2.519 | 2.804 | 3.252 | 3.094 | 3.028 | 2.857 | 2.948 | 2.818 | 3.105 | 2.990 |
| 2008 | 3.031 | 3.040 | 3.225 | 3.456 | 3.799 | 4.025 | 4.016 | 3.758 | 3.759 | 2.950 | 2.030 | 1.665 |
| 2009 | 1.846 | 1.896 | 1.961 | 2.031 | 2.304 | 2.677 | 2.484 | 2.578 | 2.471 | 2.533 | 2.630 | 2.576 |
| 2010 | 2.702 | 2.597 | 2.762 | 2.858 | 2.812 | 2.724 | 2.734 | 2.714 | 2.753 | 2.820 | 2.864 | 2.997 |
| 2011 | 3.118 | 3.216 | 3.556 | 3.845 | 3.953 | 3.709 | 3.699 | 3.677 | 3.635 | 3.400 | 3.331 | 3.243 |
| 2012 | 3.368 | 3.515 | 3.861 | 3.866 | 3.684 | 3.550 | 3.474 | 3.815 | 3.899 | 3.665 | 3.391 | 3.272 |
| 2013 | 3.249 | 3.691 | 3.700 | 3.584 | 3.772 | 3.789 | 3.582 | 3.571 | 3.548 | 3.324 | 3.203 | 3.208 |
| 2014 | 3.279 | 3.384 | 3.602 | 3.683 | 3.670 | 3.752 | 3.570 | 3.472 | 3.420 | 3.141 | 2.932 | 2.469 |
| 2015 | 2.010 | 2.241 | 2.415 | 2.428 | 2.631 | 2.797 | 2.746 | 2.657 | 2.385 | 2.403 | 2.158 | 1.962 |
| 2016 | 1.840 | 1.682 | 1.992 | 2.110 | 2.305 | 2.471 | 2.237 | 2.230 | 2.243 | 2.238 | 2.125 | 2.278 |
| 2017 | 2.360 | 2.288 | 2.313 | 2.427 | 2.374 | 2.325 | 2.305 | 2.382 | 2.572 | 2.485 | 2.596 | 2.464 |
| 2018 | 2.572 | 2.546 | 2.567 | 2.719 | 2.868 | 2.848 | 2.824 | 2.808 | 2.809 | 2.801 | 2.518 | 2.183 |
| 2019 | 2.090 | 2.238 | 2.493 | 2.757 | 2.794 | 2.673 | 2.738 | 2.599 | 2.543 | 2.523 | 2.480 | 2.475 |
| 2020 | 2.466 | 2.367 | 2.097 | 1.604 | 1.806 | 2.071 | 2.156 | 2.129 | 2.104 | 2.080 | 2.015 | 2.132 |
| 2021 | 2.287 | 2.465 | 2.782 | 2.834 | 2.941 | 3.032 | 3.094 | 3.094 | 3.103 | 3.217 | 3.270 | 3.129 |
| 2022 | 3.171 | 3.416 | 4.085 | 3.977 | 4.323 | 4.948 | 4.567 | 3.881 | 3.660 | 3.814 | 3.660 | 3.088 |
| 2023 | 3.287 | 3.303 | 3.340 | 3.584 | 3.528 | 3.547 | 3.511 | 3.775 | 3.739 | 3.445 | 3.214 | 2.964 |
| 2024 | 2.905 | 3.119 | 3.394 | |||||||||
| - = No Data Reported; -- = Not Applicable; NA = Not Available; W = Withheld to avoid disclosure of individual company data. |
| Release Date: 4/15/2024 |
| Next Release Date: 4/22/2024 |