|
Download Data (XLS File) |
|
||||||||||
|
||||||||||
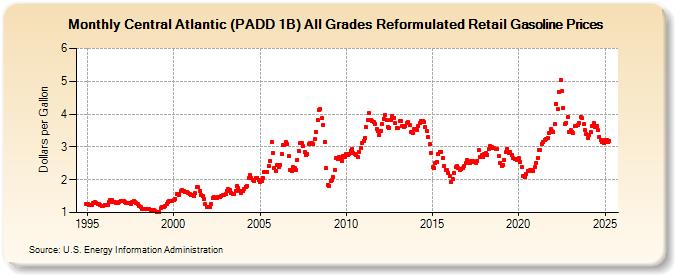
| Central Atlantic (PADD 1B) All Grades Reformulated Retail Gasoline Prices (Dollars per Gallon) | ||||||||||
| Year | Jan | Feb | Mar | Apr | May | Jun | Jul | Aug | Sep | Oct | Nov | Dec |
|---|---|---|---|---|---|---|---|---|---|---|---|---|
| 1994 | NA | 1.247 | ||||||||||
| 1995 | 1.254 | 1.244 | 1.232 | 1.232 | 1.291 | 1.321 | 1.305 | 1.273 | 1.256 | 1.229 | 1.196 | 1.198 |
| 1996 | 1.222 | 1.219 | 1.232 | 1.310 | 1.379 | 1.368 | 1.336 | 1.307 | 1.290 | 1.294 | 1.331 | 1.364 |
| 1997 | 1.367 | 1.351 | 1.318 | 1.291 | 1.278 | 1.283 | 1.270 | 1.322 | 1.355 | 1.319 | 1.285 | 1.248 |
| 1998 | 1.208 | 1.161 | 1.111 | 1.102 | 1.108 | 1.113 | 1.110 | 1.095 | 1.081 | 1.087 | 1.075 | 1.048 |
| 1999 | 1.031 | 1.005 | 1.015 | 1.127 | 1.170 | 1.168 | 1.197 | 1.267 | 1.314 | 1.343 | 1.339 | 1.364 |
| 2000 | 1.371 | 1.415 | 1.568 | 1.563 | 1.550 | 1.657 | 1.697 | 1.647 | 1.640 | 1.620 | 1.606 | 1.571 |
| 2001 | 1.534 | 1.524 | 1.495 | 1.582 | 1.767 | 1.770 | 1.653 | 1.542 | 1.505 | 1.401 | 1.258 | 1.156 |
| 2002 | 1.173 | 1.173 | 1.262 | 1.444 | 1.473 | 1.458 | 1.453 | 1.485 | 1.486 | 1.503 | 1.522 | 1.523 |
| 2003 | 1.558 | 1.665 | 1.722 | 1.679 | 1.604 | 1.551 | 1.563 | 1.651 | 1.815 | 1.737 | 1.664 | 1.610 |
| 2004 | 1.652 | 1.713 | 1.780 | 1.820 | 2.041 | 2.131 | 2.055 | 2.002 | 1.953 | 2.049 | 2.065 | 1.980 |
| 2005 | 1.924 | 1.953 | 2.056 | 2.234 | 2.241 | 2.237 | 2.404 | 2.583 | 3.164 | 2.815 | 2.345 | 2.258 |
| 2006 | 2.434 | 2.378 | 2.436 | 2.791 | 3.063 | 3.069 | 3.150 | 3.095 | 2.715 | 2.308 | 2.261 | 2.389 |
| 2007 | 2.363 | 2.307 | 2.609 | 2.871 | 3.107 | 3.104 | 3.017 | 2.839 | 2.763 | 2.786 | 3.076 | 3.107 |
| 2008 | 3.129 | 3.082 | 3.235 | 3.444 | 3.830 | 4.130 | 4.146 | 3.868 | 3.674 | 3.144 | 2.352 | 1.847 |
| 2009 | 1.811 | 1.969 | 1.991 | 2.076 | 2.301 | 2.654 | 2.627 | 2.690 | 2.643 | 2.580 | 2.720 | 2.693 |
| 2010 | 2.778 | 2.740 | 2.792 | 2.866 | 2.927 | 2.804 | 2.784 | 2.758 | 2.694 | 2.841 | 2.964 | 3.117 |
| 2011 | 3.194 | 3.276 | 3.596 | 3.829 | 4.020 | 3.828 | 3.787 | 3.770 | 3.701 | 3.541 | 3.479 | 3.368 |
| 2012 | 3.496 | 3.695 | 3.861 | 3.974 | 3.815 | 3.593 | 3.588 | 3.814 | 3.948 | 3.886 | 3.722 | 3.577 |
| 2013 | 3.562 | 3.795 | 3.783 | 3.640 | 3.617 | 3.636 | 3.720 | 3.743 | 3.671 | 3.464 | 3.419 | 3.539 |
| 2014 | 3.533 | 3.524 | 3.635 | 3.715 | 3.780 | 3.801 | 3.770 | 3.599 | 3.499 | 3.306 | 3.074 | 2.808 |
| 2015 | 2.377 | 2.345 | 2.521 | 2.552 | 2.780 | 2.855 | 2.851 | 2.662 | 2.414 | 2.308 | 2.290 | 2.220 |
| 2016 | 2.105 | 1.937 | 2.029 | 2.218 | 2.385 | 2.430 | 2.357 | 2.285 | 2.331 | 2.361 | 2.429 | 2.506 |
| 2017 | 2.604 | 2.535 | 2.502 | 2.585 | 2.572 | 2.540 | 2.503 | 2.575 | 2.895 | 2.685 | 2.740 | 2.686 |
| 2018 | 2.772 | 2.815 | 2.762 | 2.921 | 3.040 | 2.998 | 2.959 | 2.955 | 2.946 | 2.928 | 2.727 | 2.523 |
| 2019 | 2.433 | 2.439 | 2.615 | 2.844 | 2.951 | 2.819 | 2.845 | 2.759 | 2.652 | 2.622 | 2.640 | 2.613 |
| 2020 | 2.653 | 2.538 | 2.386 | 2.126 | 2.074 | 2.187 | 2.268 | 2.273 | 2.288 | 2.294 | 2.270 | 2.375 |
| 2021 | 2.519 | 2.672 | 2.920 | 2.913 | 3.076 | 3.145 | 3.210 | 3.239 | 3.282 | 3.409 | 3.534 | 3.490 |
| 2022 | 3.458 | 3.686 | 4.309 | 4.146 | 4.685 | 5.038 | 4.694 | 4.196 | 3.697 | 3.738 | 3.909 | 3.465 |
| 2023 | 3.503 | 3.467 | 3.435 | 3.622 | 3.639 | 3.652 | 3.722 | 3.914 | 3.871 | 3.687 | 3.501 | 3.381 |
| 2024 | 3.279 | 3.353 | 3.439 | |||||||||
| - = No Data Reported; -- = Not Applicable; NA = Not Available; W = Withheld to avoid disclosure of individual company data. |
| Release Date: 4/22/2024 |
| Next Release Date: 4/29/2024 |