|
Download Data (XLS File) |
|
||||||||||
|
||||||||||
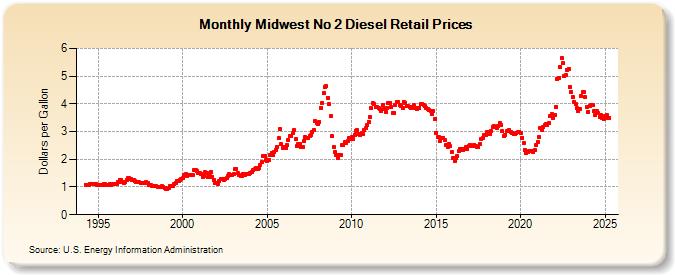
| Midwest No 2 Diesel Retail Prices (Dollars per Gallon) | ||||||||||
| Year | Jan | Feb | Mar | Apr | May | Jun | Jul | Aug | Sep | Oct | Nov | Dec |
|---|---|---|---|---|---|---|---|---|---|---|---|---|
| 1994 | NA | 1.087 | 1.082 | 1.086 | 1.094 | 1.110 | 1.102 | 1.094 | 1.101 | 1.087 | ||
| 1995 | 1.074 | 1.065 | 1.068 | 1.084 | 1.101 | 1.097 | 1.075 | 1.085 | 1.099 | 1.088 | 1.098 | 1.110 |
| 1996 | 1.119 | 1.123 | 1.172 | 1.260 | 1.247 | 1.164 | 1.145 | 1.186 | 1.249 | 1.307 | 1.314 | 1.298 |
| 1997 | 1.267 | 1.257 | 1.204 | 1.188 | 1.189 | 1.167 | 1.141 | 1.148 | 1.132 | 1.161 | 1.167 | 1.140 |
| 1998 | 1.086 | 1.060 | 1.049 | 1.049 | 1.048 | 1.022 | 1.009 | 0.985 | 1.009 | 1.020 | 1.003 | 0.950 |
| 1999 | 0.944 | 0.939 | 0.973 | 1.047 | 1.047 | 1.043 | 1.091 | 1.146 | 1.204 | 1.220 | 1.260 | 1.287 |
| 2000 | 1.324 | 1.429 | 1.463 | 1.414 | 1.426 | 1.428 | 1.420 | 1.436 | 1.610 | 1.601 | 1.580 | 1.515 |
| 2001 | 1.501 | 1.474 | 1.375 | 1.402 | 1.537 | 1.495 | 1.350 | 1.409 | 1.555 | 1.367 | 1.266 | 1.160 |
| 2002 | 1.128 | 1.126 | 1.208 | 1.294 | 1.287 | 1.264 | 1.287 | 1.313 | 1.400 | 1.461 | 1.421 | 1.430 |
| 2003 | 1.473 | 1.639 | 1.661 | 1.495 | 1.436 | 1.409 | 1.408 | 1.464 | 1.450 | 1.482 | 1.470 | 1.460 |
| 2004 | 1.520 | 1.544 | 1.596 | 1.648 | 1.677 | 1.659 | 1.693 | 1.801 | 1.889 | 2.105 | 2.112 | 1.972 |
| 2005 | 1.930 | 1.973 | 2.163 | 2.236 | 2.138 | 2.264 | 2.341 | 2.445 | 2.753 | 3.098 | 2.541 | 2.416 |
| 2006 | 2.425 | 2.420 | 2.512 | 2.694 | 2.845 | 2.851 | 2.934 | 3.051 | 2.714 | 2.475 | 2.541 | 2.562 |
| 2007 | 2.429 | 2.443 | 2.650 | 2.817 | 2.763 | 2.774 | 2.854 | 2.864 | 2.973 | 3.061 | 3.373 | 3.304 |
| 2008 | 3.270 | 3.346 | 3.855 | 4.040 | 4.382 | 4.604 | 4.630 | 4.222 | 3.984 | 3.548 | 2.824 | 2.430 |
| 2009 | 2.264 | 2.146 | 2.039 | 2.165 | 2.170 | 2.501 | 2.512 | 2.606 | 2.605 | 2.656 | 2.769 | 2.719 |
| 2010 | 2.810 | 2.739 | 2.885 | 3.033 | 3.038 | 2.916 | 2.878 | 2.931 | 2.923 | 3.039 | 3.124 | 3.222 |
| 2011 | 3.353 | 3.533 | 3.855 | 4.025 | 4.001 | 3.885 | 3.880 | 3.840 | 3.808 | 3.754 | 3.952 | 3.807 |
| 2012 | 3.723 | 3.843 | 4.019 | 4.013 | 3.877 | 3.676 | 3.682 | 3.971 | 4.062 | 4.058 | 3.950 | 3.937 |
| 2013 | 3.854 | 4.078 | 4.031 | 3.911 | 3.907 | 3.871 | 3.850 | 3.873 | 3.942 | 3.855 | 3.812 | 3.867 |
| 2014 | 3.862 | 3.982 | 3.992 | 3.942 | 3.910 | 3.860 | 3.828 | 3.782 | 3.731 | 3.631 | 3.735 | 3.460 |
| 2015 | 2.951 | 2.788 | 2.803 | 2.665 | 2.764 | 2.762 | 2.682 | 2.509 | 2.459 | 2.566 | 2.478 | 2.258 |
| 2016 | 2.059 | 1.927 | 2.054 | 2.104 | 2.282 | 2.382 | 2.371 | 2.317 | 2.372 | 2.425 | 2.381 | 2.461 |
| 2017 | 2.528 | 2.493 | 2.479 | 2.516 | 2.494 | 2.439 | 2.440 | 2.562 | 2.736 | 2.766 | 2.876 | 2.862 |
| 2018 | 2.973 | 2.995 | 2.913 | 3.013 | 3.179 | 3.185 | 3.163 | 3.143 | 3.203 | 3.325 | 3.237 | 3.010 |
| 2019 | 2.826 | 2.890 | 3.003 | 3.017 | 3.049 | 2.978 | 2.947 | 2.914 | 2.920 | 2.964 | 2.967 | 2.973 |
| 2020 | 2.945 | 2.782 | 2.587 | 2.340 | 2.237 | 2.262 | 2.307 | 2.310 | 2.295 | 2.266 | 2.322 | 2.514 |
| 2021 | 2.622 | 2.805 | 3.118 | 3.064 | 3.162 | 3.231 | 3.262 | 3.253 | 3.296 | 3.554 | 3.624 | 3.505 |
| 2022 | 3.594 | 3.891 | 4.912 | 4.936 | 5.320 | 5.662 | 5.460 | 5.000 | 5.023 | 5.226 | 5.253 | 4.609 |
| 2023 | 4.427 | 4.242 | 4.055 | 3.983 | 3.832 | 3.731 | 3.818 | 4.300 | 4.435 | 4.425 | 4.241 | 3.882 |
| 2024 | 3.716 | 3.938 | 3.943 | |||||||||
| - = No Data Reported; -- = Not Applicable; NA = Not Available; W = Withheld to avoid disclosure of individual company data. |
| Release Date: 4/22/2024 |
| Next Release Date: 4/29/2024 |