|
Download Data (XLS File) |
|
||||||||||
|
||||||||||
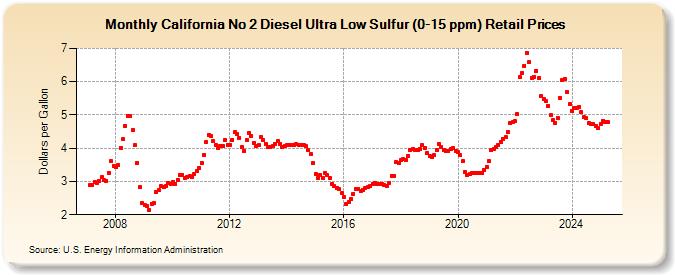
| California No 2 Diesel Ultra Low Sulfur (0-15 ppm) Retail Prices (Dollars per Gallon) | ||||||||||
| Year | Jan | Feb | Mar | Apr | May | Jun | Jul | Aug | Sep | Oct | Nov | Dec |
|---|---|---|---|---|---|---|---|---|---|---|---|---|
| 2007 | 2.886 | 2.885 | 2.985 | 2.964 | 3.019 | 3.123 | 3.049 | 3.024 | 3.267 | 3.608 | 3.475 | |
| 2008 | 3.423 | 3.488 | 4.014 | 4.265 | 4.673 | 4.968 | 4.965 | 4.542 | 4.087 | 3.568 | 2.832 | 2.345 |
| 2009 | 2.297 | 2.260 | 2.139 | 2.336 | 2.354 | 2.697 | 2.734 | 2.850 | 2.837 | 2.856 | 2.962 | 2.913 |
| 2010 | 2.997 | 2.938 | 3.058 | 3.206 | 3.205 | 3.102 | 3.124 | 3.164 | 3.144 | 3.214 | 3.305 | 3.408 |
| 2011 | 3.560 | 3.804 | 4.187 | 4.400 | 4.362 | 4.213 | 4.106 | 4.009 | 4.057 | 4.059 | 4.245 | 4.095 |
| 2012 | 4.103 | 4.251 | 4.474 | 4.419 | 4.316 | 4.027 | 3.917 | 4.240 | 4.456 | 4.376 | 4.170 | 4.076 |
| 2013 | 4.083 | 4.325 | 4.245 | 4.134 | 4.040 | 4.023 | 4.068 | 4.138 | 4.209 | 4.134 | 4.048 | 4.073 |
| 2014 | 4.082 | 4.084 | 4.092 | 4.089 | 4.119 | 4.101 | 4.110 | 4.085 | 4.054 | 3.938 | 3.813 | 3.542 |
| 2015 | 3.212 | 3.110 | 3.182 | 3.098 | 3.254 | 3.192 | 3.115 | 2.935 | 2.850 | 2.814 | 2.768 | 2.644 |
| 2016 | 2.526 | 2.335 | 2.387 | 2.459 | 2.636 | 2.782 | 2.785 | 2.722 | 2.749 | 2.817 | 2.820 | 2.851 |
| 2017 | 2.932 | 2.957 | 2.935 | 2.938 | 2.922 | 2.895 | 2.876 | 2.959 | 3.168 | 3.172 | 3.587 | 3.559 |
| 2018 | 3.639 | 3.680 | 3.654 | 3.773 | 3.941 | 3.982 | 3.957 | 3.940 | 3.973 | 4.086 | 4.018 | 3.858 |
| 2019 | 3.753 | 3.734 | 3.789 | 3.953 | 4.128 | 4.035 | 3.949 | 3.906 | 3.923 | 3.985 | 4.003 | 3.902 |
| 2020 | 3.873 | 3.787 | 3.601 | 3.283 | 3.182 | 3.216 | 3.254 | 3.263 | 3.259 | 3.246 | 3.250 | 3.356 |
| 2021 | 3.439 | 3.607 | 3.931 | 3.980 | 4.024 | 4.095 | 4.195 | 4.291 | 4.324 | 4.481 | 4.745 | 4.776 |
| 2022 | 4.803 | 5.018 | 6.133 | 6.260 | 6.479 | 6.874 | 6.587 | 6.123 | 6.149 | 6.330 | 6.121 | 5.558 |
| 2023 | 5.467 | 5.423 | 5.263 | 4.990 | 4.842 | 4.760 | 4.907 | 5.518 | 6.043 | 6.094 | 5.684 | 5.320 |
| 2024 | 5.130 | 5.214 | 5.216 | |||||||||
| - = No Data Reported; -- = Not Applicable; NA = Not Available; W = Withheld to avoid disclosure of individual company data. |
| Release Date: 4/22/2024 |
| Next Release Date: 4/29/2024 |