|
Download Data (XLS File) |
|
||||||||||
|
||||||||||
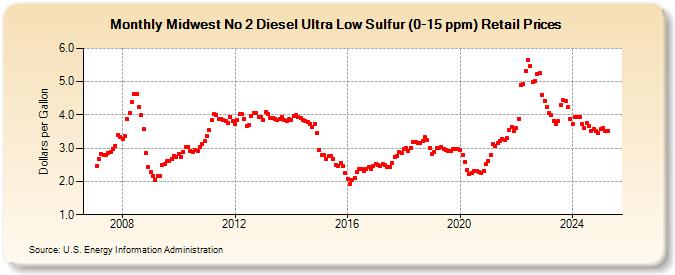
| Midwest No 2 Diesel Ultra Low Sulfur (0-15 ppm) Retail Prices (Dollars per Gallon) | ||||||||||
| Year | Jan | Feb | Mar | Apr | May | Jun | Jul | Aug | Sep | Oct | Nov | Dec |
|---|---|---|---|---|---|---|---|---|---|---|---|---|
| 2007 | 2.464 | 2.661 | 2.831 | 2.784 | 2.795 | 2.870 | 2.881 | 2.986 | 3.077 | 3.394 | 3.326 | |
| 2008 | 3.289 | 3.358 | 3.865 | 4.053 | 4.392 | 4.615 | 4.638 | 4.236 | 4.001 | 3.570 | 2.844 | 2.441 |
| 2009 | 2.278 | 2.154 | 2.041 | 2.169 | 2.175 | 2.505 | 2.517 | 2.612 | 2.609 | 2.662 | 2.776 | 2.727 |
| 2010 | 2.815 | 2.744 | 2.886 | 3.037 | 3.041 | 2.916 | 2.879 | 2.931 | 2.923 | 3.039 | 3.124 | 3.222 |
| 2011 | 3.353 | 3.533 | 3.855 | 4.025 | 4.001 | 3.885 | 3.880 | 3.840 | 3.808 | 3.754 | 3.952 | 3.807 |
| 2012 | 3.723 | 3.843 | 4.019 | 4.013 | 3.877 | 3.676 | 3.682 | 3.971 | 4.062 | 4.058 | 3.950 | 3.937 |
| 2013 | 3.854 | 4.078 | 4.031 | 3.911 | 3.907 | 3.871 | 3.850 | 3.873 | 3.942 | 3.855 | 3.812 | 3.867 |
| 2014 | 3.862 | 3.982 | 3.992 | 3.942 | 3.910 | 3.860 | 3.828 | 3.782 | 3.731 | 3.631 | 3.735 | 3.460 |
| 2015 | 2.951 | 2.788 | 2.803 | 2.665 | 2.764 | 2.762 | 2.682 | 2.509 | 2.459 | 2.566 | 2.478 | 2.258 |
| 2016 | 2.059 | 1.927 | 2.054 | 2.104 | 2.282 | 2.382 | 2.371 | 2.317 | 2.372 | 2.425 | 2.381 | 2.461 |
| 2017 | 2.528 | 2.493 | 2.479 | 2.516 | 2.494 | 2.439 | 2.440 | 2.562 | 2.736 | 2.766 | 2.876 | 2.862 |
| 2018 | 2.973 | 2.995 | 2.913 | 3.013 | 3.179 | 3.185 | 3.163 | 3.143 | 3.203 | 3.325 | 3.237 | 3.010 |
| 2019 | 2.826 | 2.890 | 3.003 | 3.017 | 3.049 | 2.978 | 2.947 | 2.914 | 2.920 | 2.964 | 2.967 | 2.973 |
| 2020 | 2.945 | 2.782 | 2.587 | 2.340 | 2.237 | 2.262 | 2.307 | 2.310 | 2.295 | 2.266 | 2.322 | 2.514 |
| 2021 | 2.622 | 2.805 | 3.118 | 3.064 | 3.162 | 3.231 | 3.262 | 3.253 | 3.296 | 3.554 | 3.624 | 3.505 |
| 2022 | 3.594 | 3.891 | 4.912 | 4.936 | 5.320 | 5.662 | 5.460 | 5.000 | 5.023 | 5.226 | 5.253 | 4.609 |
| 2023 | 4.427 | 4.242 | 4.055 | 3.983 | 3.832 | 3.731 | 3.818 | 4.300 | 4.435 | 4.425 | 4.241 | 3.882 |
| 2024 | 3.716 | 3.938 | 3.943 | 3.948 | 3.725 | 3.597 | 3.747 | 3.678 | ||||
| - = No Data Reported; -- = Not Applicable; NA = Not Available; W = Withheld to avoid disclosure of individual company data. |
| Release Date: 9/16/2024 |
| Next Release Date: 9/23/2024 |