|
Download Data (XLS File) |
|
||||||||
|
||||||||
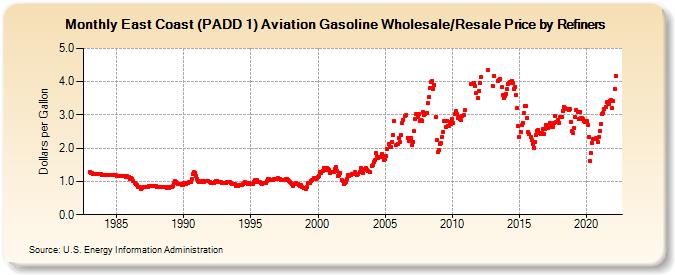
| East Coast (PADD 1) Aviation Gasoline Wholesale/Resale Price by Refiners (Dollars per Gallon) | ||||||||
| Year | Jan | Feb | Mar | Apr | May | Jun | Jul | Aug | Sep | Oct | Nov | Dec |
|---|---|---|---|---|---|---|---|---|---|---|---|---|
| 1983 | 1.289 | 1.268 | 1.246 | 1.230 | 1.227 | 1.226 | 1.225 | 1.226 | 1.220 | 1.219 | 1.211 | 1.206 |
| 1984 | 1.197 | 1.199 | 1.184 | 1.196 | 1.202 | 1.202 | 1.204 | 1.197 | 1.197 | 1.189 | 1.189 | 1.181 |
| 1985 | 1.175 | 1.159 | 1.162 | 1.156 | 1.160 | 1.161 | 1.157 | 1.154 | 1.147 | 1.150 | 1.127 | 1.126 |
| 1986 | 1.080 | 1.114 | 1.069 | 1.006 | 0.957 | 0.936 | 0.885 | 0.833 | 0.840 | 0.835 | 0.777 | 0.793 |
| 1987 | 0.820 | 0.828 | 0.823 | 0.821 | 0.831 | 0.854 | 0.859 | 0.878 | 0.865 | 0.869 | 0.868 | 0.861 |
| 1988 | 0.842 | 0.824 | 0.822 | 0.825 | 0.829 | 0.838 | 0.845 | 0.838 | 0.830 | 0.816 | 0.824 | 0.814 |
| 1989 | 0.834 | 0.848 | 0.850 | 0.957 | 1.000 | 0.988 | 0.955 | 0.935 | 0.932 | 0.925 | 0.904 | 0.898 |
| 1990 | 0.952 | 0.951 | 0.919 | 0.942 | 0.966 | 0.984 | 0.973 | 1.076 | 1.220 | 1.273 | 1.255 | 1.151 |
| 1991 | 1.087 | 1.018 | 0.971 | 0.975 | 1.000 | 1.006 | 0.994 | 1.005 | 1.005 | 1.004 | 1.004 | 0.979 |
| 1992 | 0.949 | 0.944 | 0.944 | 0.966 | 0.989 | 1.007 | 1.016 | 0.990 | 0.998 | 0.991 | 0.967 | 0.961 |
| 1993 | 0.964 | 0.963 | 0.961 | 0.971 | 0.974 | 0.969 | 0.943 | 0.932 | 0.926 | 0.932 | 0.918 | 0.875 |
| 1994 | 0.867 | 0.886 | 0.887 | 0.890 | 0.905 | 0.927 | 0.957 | 0.976 | 0.946 | 0.932 | 0.942 | 0.938 |
| 1995 | 0.926 | 0.923 | 0.928 | 0.973 | 1.041 | 1.039 | 0.991 | 0.983 | 0.975 | 0.946 | 0.934 | 0.940 |
| 1996 | 0.951 | 0.954 | 1.002 | 1.062 | 1.069 | 1.033 | 1.041 | 1.045 | 1.043 | 1.069 | 1.087 | 1.080 |
| 1997 | 1.096 | 1.087 | 1.064 | 1.057 | 1.055 | 1.042 | 1.031 | 1.085 | 1.074 | 1.044 | 1.014 | 0.979 |
| 1998 | 0.945 | 0.921 | 0.876 | 0.932 | 0.947 | 0.928 | 0.916 | 0.887 | 0.877 | 0.891 | 0.832 | 0.799 |
| 1999 | 0.808 | 0.788 | 0.842 | 0.950 | 0.967 | 0.958 | 1.000 | 1.057 | 1.096 | 1.088 | 1.072 | 1.101 |
| 2000 | 1.122 | 1.175 | 1.284 | 1.239 | 1.315 | 1.418 | 1.395 | 1.338 | 1.419 | 1.378 | 1.348 | 1.252 |
| 2001 | 1.286 | 1.298 | 1.271 | 1.372 | 1.434 | 1.308 | 1.160 | 1.195 | 1.263 | 1.053 | 1.009 | 0.935 |
| 2002 | 0.966 | 0.994 | 1.075 | 1.186 | 1.176 | 1.198 | 1.226 | 1.221 | 1.232 | 1.273 | 1.222 | 1.181 |
| 2003 | 1.212 | 1.294 | 1.399 | 1.308 | 1.262 | NA | 1.373 | 1.407 | 1.353 | 1.300 | 1.274 | NA |
| 2004 | 1.464 | 1.499 | 1.583 | 1.652 | 1.852 | 1.750 | 1.718 | 1.737 | 1.720 | 1.833 | 1.769 | 1.653 |
| 2005 | 1.672 | 1.756 | 1.972 | 2.137 | 2.048 | 2.041 | 2.196 | 2.404 | 2.803 | NA | 2.104 | 2.121 |
| 2006 | 2.301 | 2.184 | 2.411 | 2.772 | 2.848 | NA | 2.954 | 3.011 | 2.320 | 2.216 | 2.273 | 2.302 |
| 2007 | 2.102 | 2.198 | 2.504 | 2.880 | 3.032 | 2.942 | 3.031 | 2.806 | 2.860 | 2.827 | 3.100 | 2.995 |
| 2008 | 3.042 | 3.051 | 3.347 | 3.533 | 3.821 | 4.004 | 4.033 | 3.792 | 3.912 | 2.941 | 2.241 | 1.877 |
| 2009 | 1.944 | 2.129 | 2.151 | 2.327 | 2.488 | 2.816 | 2.626 | 2.803 | 2.668 | 2.680 | 2.786 | 2.726 |
| 2010 | 2.873 | 2.760 | 3.014 | 3.104 | 3.013 | 2.893 | 2.928 | 2.882 | 2.837 | 2.960 | 3.004 | 3.142 |
| 2011 | W | W | W | W | W | 3.920 | W | 3.967 | 3.884 | 3.649 | W | 3.521 |
| 2012 | 3.720 | 3.947 | 4.151 | W | W | W | W | W | 4.347 | W | W | W |
| 2013 | 3.879 | 4.180 | W | W | W | 4.030 | 4.064 | 4.087 | 3.827 | 3.596 | 3.497 | 3.578 |
| 2014 | 3.630 | 3.785 | 3.920 | 3.968 | 3.987 | 4.032 | 3.955 | 3.791 | 3.830 | 3.584 | 3.197 | 2.655 |
| 2015 | 2.351 | 2.485 | 2.709 | 2.764 | 3.057 | 3.279 | 3.260 | 2.919 | 2.497 | 2.415 | 2.343 | 2.241 |
| 2016 | 2.134 | 2.009 | 2.192 | 2.404 | 2.512 | 2.559 | 2.465 | 2.432 | 2.469 | 2.576 | 2.438 | 2.573 |
| 2017 | 2.698 | 2.653 | 2.621 | 2.760 | 2.698 | 2.632 | 2.625 | 2.752 | 2.977 | 2.783 | 2.853 | 2.763 |
| 2018 | 2.923 | 2.939 | 2.951 | 3.103 | 3.243 | 3.200 | 3.171 | 3.169 | 3.139 | 3.170 | 2.780 | 2.505 |
| 2019 | 2.450 | 2.599 | 2.930 | 3.156 | 3.087 | 2.885 | 3.097 | 2.902 | 2.893 | 2.877 | 2.832 | 2.781 |
| 2020 | 2.818 | 2.699 | 2.332 | 1.621 | 1.855 | 2.149 | 2.273 | 2.274 | 2.293 | 2.265 | 2.175 | 2.341 |
| 2021 | 2.525 | 2.724 | 3.032 | 3.053 | 3.164 | 3.238 | 3.377 | 3.350 | 3.318 | 3.433 | 3.462 | 3.207 |
| 2022 | 3.408 | 3.778 | 4.172 | |||||||||
| - = No Data Reported; -- = Not Applicable; NA = Not Available; W = Withheld to avoid disclosure of individual company data. |
| Release Date: 6/1/2022 |
| Next Release Date: TBD |