|
Download Data (XLS File) |
|
||||||||
|
||||||||
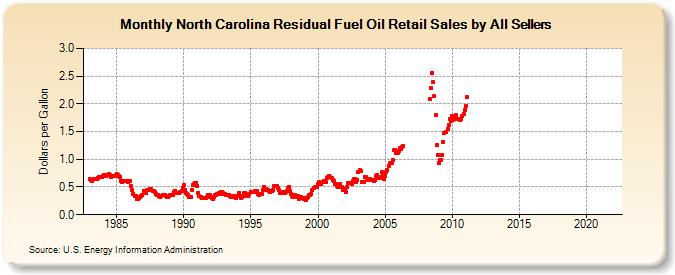
| North Carolina Residual Fuel Oil Retail Sales by All Sellers (Dollars per Gallon) | ||||||||
| Year | Jan | Feb | Mar | Apr | May | Jun | Jul | Aug | Sep | Oct | Nov | Dec |
|---|---|---|---|---|---|---|---|---|---|---|---|---|
| 1983 | 0.648 | 0.621 | 0.612 | W | 0.640 | 0.641 | 0.649 | 0.666 | 0.685 | 0.683 | 0.685 | 0.680 |
| 1984 | 0.698 | 0.710 | 0.696 | 0.709 | 0.718 | 0.732 | 0.710 | 0.688 | 0.693 | 0.705 | 0.705 | 0.708 |
| 1985 | 0.727 | 0.716 | 0.692 | 0.673 | 0.614 | 0.586 | 0.608 | 0.600 | 0.607 | 0.613 | 0.596 | 0.615 |
| 1986 | 0.612 | 0.516 | 0.441 | 0.379 | 0.338 | 0.335 | 0.289 | 0.282 | 0.306 | 0.312 | 0.340 | 0.361 |
| 1987 | 0.434 | 0.429 | 0.399 | 0.437 | 0.450 | 0.453 | 0.461 | 0.459 | 0.433 | 0.430 | 0.415 | 0.371 |
| 1988 | 0.359 | 0.360 | 0.337 | 0.321 | 0.345 | 0.350 | 0.348 | 0.347 | 0.340 | 0.315 | 0.328 | 0.341 |
| 1989 | 0.362 | 0.353 | 0.358 | 0.402 | 0.424 | 0.392 | 0.395 | 0.392 | 0.396 | 0.406 | 0.424 | 0.486 |
| 1990 | 0.534 | 0.451 | 0.400 | 0.365 | 0.350 | 0.317 | 0.321 | 0.452 | 0.529 | 0.562 | 0.572 | 0.576 |
| 1991 | 0.518 | 0.398 | 0.332 | 0.313 | 0.304 | 0.293 | 0.297 | 0.301 | 0.306 | 0.323 | 0.353 | 0.361 |
| 1992 | 0.325 | 0.296 | 0.291 | 0.312 | 0.350 | 0.361 | 0.380 | 0.388 | 0.379 | 0.404 | 0.417 | 0.398 |
| 1993 | 0.372 | 0.368 | 0.356 | 0.363 | 0.359 | 0.339 | 0.328 | 0.329 | 0.328 | 0.333 | 0.320 | 0.293 |
| 1994 | 0.338 | 0.385 | 0.345 | 0.302 | 0.322 | 0.338 | 0.385 | 0.388 | 0.341 | 0.343 | 0.382 | W |
| 1995 | 0.418 | 0.416 | 0.415 | 0.409 | 0.430 | 0.423 | 0.375 | 0.363 | 0.375 | 0.366 | 0.375 | 0.439 |
| 1996 | 0.501 | 0.458 | 0.452 | 0.453 | 0.429 | 0.404 | 0.421 | 0.423 | 0.446 | 0.513 | 0.524 | 0.521 |
| 1997 | 0.487 | 0.444 | 0.395 | 0.392 | 0.397 | 0.401 | 0.390 | 0.415 | 0.428 | 0.473 | 0.501 | 0.426 |
| 1998 | 0.370 | 0.338 | 0.315 | 0.354 | 0.335 | 0.327 | 0.330 | 0.290 | 0.302 | 0.319 | 0.310 | 0.286 |
| 1999 | 0.299 | 0.270 | 0.298 | 0.318 | 0.349 | 0.361 | 0.370 | 0.437 | 0.490 | 0.498 | 0.498 | 0.499 |
| 2000 | 0.554 | 0.585 | 0.560 | 0.547 | 0.589 | 0.613 | 0.614 | 0.582 | 0.663 | 0.684 | 0.699 | 0.672 |
| 2001 | 0.666 | 0.626 | 0.604 | 0.549 | 0.549 | 0.518 | 0.504 | 0.521 | 0.556 | 0.496 | 0.437 | 0.441 |
| 2002 | 0.461 | 0.412 | 0.500 | 0.567 | 0.580 | 0.568 | 0.556 | 0.609 | 0.644 | 0.643 | 0.583 | 0.627 |
| 2003 | 0.765 | 0.809 | 0.793 | 0.593 | 0.582 | 0.589 | 0.678 | 0.676 | 0.624 | 0.621 | 0.641 | 0.622 |
| 2004 | 0.623 | 0.634 | 0.605 | 0.623 | 0.699 | 0.722 | 0.654 | 0.671 | 0.673 | 0.765 | 0.728 | 0.653 |
| 2005 | 0.702 | 0.771 | 0.801 | 0.878 | 0.930 | 0.938 | 0.937 | 0.981 | 1.170 | 1.174 | 1.115 | 1.106 |
| 2006 | 1.151 | 1.204 | 1.187 | 1.219 | 1.244 | W | W | W | W | W | W | W |
| 2007 | W | W | W | W | W | W | W | W | W | W | W | W |
| 2008 | W | W | W | W | 2.089 | 2.291 | 2.562 | 2.387 | 2.134 | 1.802 | 1.249 | 1.081 |
| 2009 | 0.931 | 0.995 | 0.980 | 1.079 | 1.314 | 1.471 | 1.483 | W | 1.546 | 1.622 | 1.721 | 1.699 |
| 2010 | 1.777 | 1.704 | 1.722 | 1.796 | 1.718 | 1.725 | 1.720 | 1.716 | 1.734 | 1.781 | 1.824 | 1.893 |
| 2011 | 1.952 | 2.124 | - | - | - | - | - | - | - | - | - | - |
| 2012 | - | - | - | - | - | - | - | - | - | - | - | - |
| 2013 | - | - | - | - | - | - | - | - | - | - | - | - |
| 2014 | - | - | - | - | - | - | - | - | - | - | - | - |
| 2015 | - | - | - | - | - | - | - | - | - | - | - | - |
| 2016 | - | - | - | - | - | - | - | - | - | - | - | - |
| 2017 | - | - | - | - | - | - | - | - | - | - | - | - |
| 2018 | - | - | - | - | - | - | - | - | - | - | - | - |
| 2019 | - | - | - | - | - | - | - | - | - | - | - | - |
| 2020 | - | - | - | - | - | - | - | - | - | - | - | - |
| 2021 | - | - | - | - | - | - | - | - | - | - | - | - |
| 2022 | - | - | - | |||||||||
| - = No Data Reported; -- = Not Applicable; NA = Not Available; W = Withheld to avoid disclosure of individual company data. |
| Release Date: 6/1/2022 |
| Next Release Date: TBD |