|
Download Data (XLS File) |
|
||||||||
|
||||||||
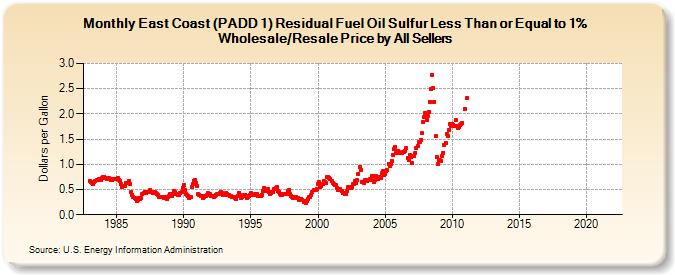
| East Coast (PADD 1) Residual Fuel Oil Sulfur Less Than or Equal to 1% Wholesale/Resale Price by All Sellers (Dollars per Gallon) | ||||||||
| Year | Jan | Feb | Mar | Apr | May | Jun | Jul | Aug | Sep | Oct | Nov | Dec |
|---|---|---|---|---|---|---|---|---|---|---|---|---|
| 1983 | 0.673 | 0.645 | 0.621 | 0.619 | 0.650 | 0.661 | 0.687 | 0.691 | 0.706 | 0.698 | 0.696 | 0.722 |
| 1984 | 0.754 | 0.754 | 0.735 | 0.714 | 0.716 | 0.722 | 0.703 | 0.698 | 0.698 | 0.707 | 0.701 | 0.702 |
| 1985 | 0.709 | 0.721 | 0.698 | 0.659 | 0.612 | 0.557 | 0.561 | 0.564 | 0.635 | 0.639 | 0.632 | 0.669 |
| 1986 | 0.612 | 0.448 | 0.400 | 0.344 | 0.336 | 0.320 | 0.266 | 0.291 | 0.322 | 0.318 | 0.326 | 0.402 |
| 1987 | 0.433 | 0.446 | 0.431 | 0.441 | 0.456 | 0.460 | 0.482 | 0.457 | 0.428 | 0.435 | 0.452 | 0.431 |
| 1988 | 0.412 | 0.387 | 0.354 | 0.361 | 0.361 | 0.356 | 0.339 | 0.349 | 0.339 | 0.319 | 0.344 | 0.369 |
| 1989 | 0.406 | 0.381 | 0.415 | 0.463 | 0.451 | 0.412 | 0.407 | 0.395 | 0.393 | 0.440 | 0.441 | 0.536 |
| 1990 | 0.596 | 0.485 | 0.411 | 0.386 | 0.370 | 0.332 | 0.350 | 0.543 | 0.605 | 0.674 | 0.685 | 0.638 |
| 1991 | 0.565 | 0.419 | 0.392 | 0.381 | 0.365 | 0.338 | 0.346 | 0.372 | 0.378 | 0.387 | 0.421 | 0.403 |
| 1992 | 0.381 | 0.372 | 0.365 | 0.359 | 0.379 | 0.388 | 0.412 | 0.409 | 0.421 | 0.454 | 0.439 | 0.392 |
| 1993 | 0.412 | 0.398 | 0.428 | 0.411 | 0.399 | 0.366 | 0.362 | 0.351 | 0.349 | 0.348 | 0.324 | 0.313 |
| 1994 | 0.375 | 0.433 | 0.382 | 0.335 | 0.347 | 0.378 | 0.394 | 0.396 | 0.338 | 0.347 | 0.373 | 0.399 |
| 1995 | 0.424 | 0.397 | 0.400 | 0.382 | 0.416 | 0.417 | 0.381 | 0.364 | 0.366 | 0.368 | 0.394 | 0.466 |
| 1996 | 0.529 | 0.461 | 0.486 | 0.502 | 0.453 | 0.416 | 0.431 | 0.443 | 0.456 | 0.519 | 0.523 | 0.544 |
| 1997 | 0.477 | 0.452 | 0.412 | 0.396 | 0.398 | 0.403 | 0.411 | 0.413 | 0.417 | 0.479 | 0.497 | 0.417 |
| 1998 | 0.377 | 0.355 | 0.335 | 0.348 | 0.348 | 0.330 | 0.329 | 0.289 | 0.305 | 0.318 | 0.293 | 0.262 |
| 1999 | 0.278 | 0.242 | 0.280 | 0.319 | 0.360 | 0.360 | 0.398 | 0.454 | 0.486 | 0.489 | 0.493 | 0.511 |
| 2000 | 0.604 | 0.644 | 0.545 | 0.561 | 0.605 | 0.662 | 0.648 | 0.623 | 0.748 | 0.752 | 0.734 | 0.710 |
| 2001 | 0.671 | 0.638 | 0.610 | 0.580 | 0.588 | 0.526 | 0.499 | 0.503 | 0.512 | 0.463 | 0.426 | 0.426 |
| 2002 | 0.419 | 0.413 | 0.475 | 0.549 | 0.558 | 0.538 | 0.554 | 0.608 | 0.615 | 0.664 | 0.622 | 0.688 |
| 2003 | 0.813 | 0.946 | 0.895 | 0.652 | 0.650 | 0.633 | 0.683 | 0.691 | 0.668 | 0.688 | 0.702 | 0.685 |
| 2004 | 0.763 | 0.762 | 0.645 | 0.696 | 0.760 | 0.745 | 0.713 | 0.753 | 0.720 | 0.822 | 0.862 | 0.784 |
| 2005 | 0.810 | 0.864 | 0.879 | 1.014 | 0.957 | 1.004 | 1.067 | 1.192 | 1.298 | 1.350 | 1.221 | 1.264 |
| 2006 | 1.246 | 1.222 | 1.230 | 1.234 | 1.249 | 1.250 | 1.270 | 1.317 | 1.134 | 1.083 | 1.194 | 1.143 |
| 2007 | 1.020 | 1.162 | 1.164 | 1.229 | 1.326 | 1.365 | 1.443 | 1.445 | 1.480 | 1.614 | 1.835 | 1.947 |
| 2008 | 2.026 | 1.877 | 1.964 | 2.046 | 2.244 | 2.498 | 2.780 | 2.508 | 2.241 | 1.560 | 1.136 | 1.010 |
| 2009 | 1.083 | 1.085 | 1.069 | 1.170 | 1.232 | 1.387 | 1.428 | 1.598 | 1.559 | 1.685 | 1.795 | 1.752 |
| 2010 | 1.795 | 1.788 | 1.769 | 1.875 | 1.767 | 1.715 | 1.739 | 1.781 | 1.805 | 1.823 | NA | 2.106 |
| 2011 | NA | 2.318 | - | - | - | - | - | - | - | - | - | - |
| 2012 | - | - | - | - | - | - | - | - | - | - | - | - |
| 2013 | - | - | - | - | - | - | - | - | - | - | - | - |
| 2014 | - | - | - | - | - | - | - | - | - | - | - | - |
| 2015 | - | - | - | - | - | - | - | - | - | - | - | - |
| 2016 | - | - | - | - | - | - | - | - | - | - | - | - |
| 2017 | - | - | - | - | - | - | - | - | - | - | - | - |
| 2018 | - | - | - | - | - | - | - | - | - | - | - | - |
| 2019 | - | - | - | - | - | - | - | - | - | - | - | - |
| 2020 | - | - | - | - | - | - | - | - | - | - | - | - |
| 2021 | - | - | - | - | - | - | - | - | - | - | - | - |
| 2022 | - | - | - | |||||||||
| - = No Data Reported; -- = Not Applicable; NA = Not Available; W = Withheld to avoid disclosure of individual company data. |
| Release Date: 6/1/2022 |
| Next Release Date: TBD |