|
Download Data (XLS File) |
|
||||||||
|
||||||||
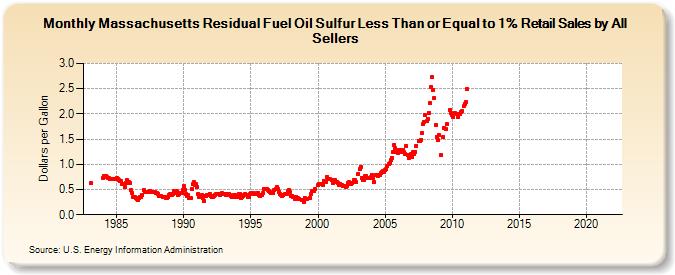
| Massachusetts Residual Fuel Oil Sulfur Less Than or Equal to 1% Retail Sales by All Sellers (Dollars per Gallon) | ||||||||
| Year | Jan | Feb | Mar | Apr | May | Jun | Jul | Aug | Sep | Oct | Nov | Dec |
|---|---|---|---|---|---|---|---|---|---|---|---|---|
| 1983 | W | 0.624 | W | W | W | W | W | W | W | W | W | W |
| 1984 | 0.735 | 0.766 | 0.773 | 0.740 | 0.726 | 0.726 | 0.718 | 0.702 | 0.699 | 0.718 | 0.712 | 0.713 |
| 1985 | 0.736 | 0.714 | 0.698 | 0.674 | 0.667 | 0.616 | 0.608 | 0.559 | 0.634 | 0.686 | 0.633 | 0.645 |
| 1986 | 0.628 | 0.483 | 0.432 | 0.348 | 0.349 | 0.333 | 0.308 | 0.292 | 0.336 | 0.353 | 0.357 | 0.387 |
| 1987 | 0.485 | 0.446 | 0.443 | 0.460 | 0.457 | 0.456 | 0.474 | 0.442 | 0.457 | 0.445 | 0.456 | 0.430 |
| 1988 | 0.431 | 0.416 | 0.372 | 0.362 | 0.376 | 0.348 | 0.348 | 0.351 | 0.323 | 0.339 | 0.350 | 0.394 |
| 1989 | 0.408 | 0.390 | 0.409 | 0.462 | 0.453 | 0.435 | 0.464 | 0.385 | 0.406 | 0.439 | 0.435 | 0.496 |
| 1990 | 0.570 | 0.486 | 0.410 | 0.362 | 0.382 | 0.328 | 0.340 | 0.510 | 0.600 | 0.640 | 0.592 | 0.600 |
| 1991 | 0.552 | 0.413 | 0.361 | 0.364 | 0.391 | 0.328 | 0.274 | 0.371 | 0.365 | 0.399 | 0.398 | 0.416 |
| 1992 | 0.362 | 0.358 | 0.360 | 0.378 | 0.392 | 0.406 | 0.403 | 0.418 | 0.398 | NA | 0.428 | 0.416 |
| 1993 | 0.405 | 0.409 | 0.386 | 0.407 | 0.419 | 0.396 | 0.374 | 0.348 | 0.360 | 0.393 | 0.389 | 0.349 |
| 1994 | 0.359 | 0.410 | 0.415 | 0.341 | 0.351 | 0.371 | 0.393 | 0.411 | 0.386 | 0.357 | 0.360 | 0.408 |
| 1995 | 0.423 | 0.424 | 0.435 | 0.416 | 0.408 | 0.427 | 0.430 | 0.387 | 0.371 | 0.389 | 0.387 | 0.426 |
| 1996 | 0.512 | 0.507 | 0.504 | 0.500 | 0.477 | 0.451 | 0.425 | 0.430 | 0.438 | 0.487 | 0.510 | 0.547 |
| 1997 | 0.512 | 0.456 | 0.401 | 0.390 | 0.379 | 0.400 | 0.402 | 0.413 | 0.410 | 0.461 | 0.489 | 0.451 |
| 1998 | 0.374 | 0.369 | 0.342 | 0.320 | 0.347 | 0.338 | 0.331 | 0.318 | W | W | 0.289 | 0.258 |
| 1999 | 0.338 | 0.314 | 0.319 | W | W | 0.339 | 0.420 | 0.468 | 0.474 | 0.508 | W | NA |
| 2000 | 0.580 | 0.611 | 0.605 | 0.613 | 0.597 | 0.672 | NA | 0.647 | 0.758 | 0.717 | 0.708 | 0.699 |
| 2001 | 0.683 | 0.632 | NA | 0.684 | NA | 0.656 | 0.635 | 0.584 | 0.618 | 0.586 | 0.577 | 0.564 |
| 2002 | 0.568 | 0.553 | 0.576 | 0.624 | 0.647 | 0.606 | 0.628 | NA | 0.682 | 0.681 | 0.646 | NA |
| 2003 | 0.813 | 0.911 | 0.947 | 0.734 | 0.698 | 0.697 | 0.761 | 0.771 | 0.732 | NA | 0.726 | 0.741 |
| 2004 | 0.788 | 0.724 | 0.650 | NA | 0.792 | 0.795 | 0.771 | 0.788 | 0.824 | 0.847 | 0.875 | 0.840 |
| 2005 | 0.884 | 0.901 | 0.963 | 1.006 | 1.023 | 1.089 | 1.130 | 1.245 | 1.388 | 1.314 | 1.247 | 1.222 |
| 2006 | 1.283 | 1.278 | 1.269 | 1.246 | 1.279 | 1.239 | 1.213 | 1.359 | 1.183 | 1.118 | 1.186 | 1.200 |
| 2007 | 1.150 | 1.242 | 1.214 | 1.252 | 1.364 | W | 1.461 | 1.460 | 1.491 | 1.620 | 1.790 | 1.847 |
| 2008 | 1.973 | 1.854 | 1.903 | 2.022 | 2.210 | 2.542 | 2.725 | 2.481 | 2.320 | 1.780 | 1.548 | 1.479 |
| 2009 | 1.586 | NA | 1.179 | NA | 1.539 | 1.718 | 1.708 | 1.799 | NA | NA | 2.079 | 2.008 |
| 2010 | 1.986 | 1.934 | 2.025 | W | 1.992 | 1.940 | W | 2.006 | 2.028 | 2.059 | 2.151 | 2.202 |
| 2011 | 2.234 | 2.486 | - | - | - | - | - | - | - | - | - | - |
| 2012 | - | - | - | - | - | - | - | - | - | - | - | - |
| 2013 | - | - | - | - | - | - | - | - | - | - | - | - |
| 2014 | - | - | - | - | - | - | - | - | - | - | - | - |
| 2015 | - | - | - | - | - | - | - | - | - | - | - | - |
| 2016 | - | - | - | - | - | - | - | - | - | - | - | - |
| 2017 | - | - | - | - | - | - | - | - | - | - | - | - |
| 2018 | - | - | - | - | - | - | - | - | - | - | - | - |
| 2019 | - | - | - | - | - | - | - | - | - | - | - | - |
| 2020 | - | - | - | - | - | - | - | - | - | - | - | - |
| 2021 | - | - | - | - | - | - | - | - | - | - | - | - |
| 2022 | - | - | - | |||||||||
| - = No Data Reported; -- = Not Applicable; NA = Not Available; W = Withheld to avoid disclosure of individual company data. |
| Release Date: 6/1/2022 |
| Next Release Date: TBD |