|
Download Data (XLS File) |
|
||||||||
|
||||||||
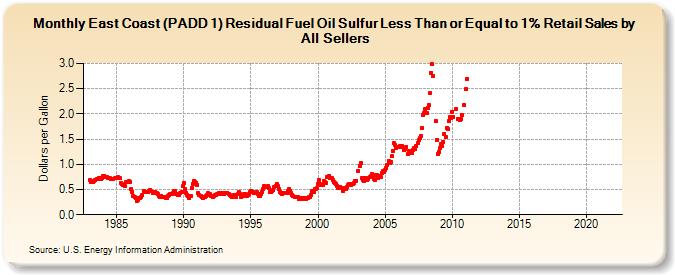
| East Coast (PADD 1) Residual Fuel Oil Sulfur Less Than or Equal to 1% Retail Sales by All Sellers (Dollars per Gallon) | ||||||||
| Year | Jan | Feb | Mar | Apr | May | Jun | Jul | Aug | Sep | Oct | Nov | Dec |
|---|---|---|---|---|---|---|---|---|---|---|---|---|
| 1983 | 0.684 | 0.656 | 0.642 | 0.651 | 0.669 | 0.689 | 0.705 | 0.716 | 0.727 | 0.714 | 0.710 | 0.724 |
| 1984 | 0.759 | 0.774 | 0.751 | 0.751 | 0.738 | 0.738 | 0.722 | 0.699 | 0.711 | 0.718 | 0.720 | 0.722 |
| 1985 | 0.736 | 0.743 | 0.730 | 0.720 | 0.631 | 0.601 | 0.596 | 0.576 | 0.651 | 0.645 | 0.642 | 0.666 |
| 1986 | 0.652 | 0.508 | 0.458 | 0.381 | 0.354 | 0.335 | 0.277 | 0.299 | 0.326 | 0.326 | 0.346 | 0.390 |
| 1987 | 0.473 | 0.457 | 0.444 | 0.452 | 0.455 | 0.461 | 0.482 | 0.462 | 0.433 | 0.447 | 0.457 | 0.423 |
| 1988 | 0.427 | 0.416 | 0.373 | 0.361 | 0.365 | 0.350 | 0.354 | 0.358 | 0.340 | 0.334 | 0.362 | 0.393 |
| 1989 | 0.420 | 0.404 | 0.423 | 0.470 | 0.464 | 0.419 | 0.410 | 0.398 | 0.396 | 0.438 | 0.455 | 0.561 |
| 1990 | 0.638 | 0.503 | 0.439 | 0.396 | 0.376 | 0.335 | 0.367 | 0.525 | 0.610 | 0.677 | 0.655 | 0.631 |
| 1991 | 0.587 | 0.430 | 0.382 | 0.375 | 0.358 | 0.336 | 0.346 | 0.360 | 0.368 | 0.390 | 0.424 | 0.413 |
| 1992 | 0.378 | 0.373 | 0.358 | 0.372 | 0.387 | 0.400 | 0.411 | 0.422 | 0.420 | 0.431 | 0.437 | 0.419 |
| 1993 | 0.415 | 0.425 | 0.422 | 0.439 | 0.419 | 0.389 | 0.381 | 0.358 | 0.366 | 0.390 | 0.388 | 0.354 |
| 1994 | 0.403 | 0.445 | 0.409 | 0.353 | 0.362 | 0.377 | 0.401 | 0.410 | 0.377 | 0.388 | 0.415 | 0.448 |
| 1995 | 0.469 | 0.457 | 0.456 | 0.437 | 0.438 | 0.442 | 0.415 | 0.379 | 0.380 | 0.411 | 0.448 | 0.508 |
| 1996 | 0.570 | 0.551 | 0.555 | 0.561 | 0.524 | 0.452 | 0.453 | 0.461 | 0.488 | 0.554 | 0.573 | 0.607 |
| 1997 | 0.562 | 0.513 | 0.457 | 0.433 | 0.412 | 0.426 | 0.422 | 0.422 | 0.428 | 0.479 | 0.513 | 0.476 |
| 1998 | 0.432 | 0.397 | 0.368 | 0.359 | 0.359 | 0.355 | 0.344 | 0.320 | 0.312 | 0.330 | 0.332 | 0.303 |
| 1999 | 0.340 | 0.319 | 0.329 | 0.331 | 0.353 | 0.349 | 0.398 | 0.461 | 0.452 | 0.511 | 0.514 | 0.528 |
| 2000 | 0.617 | 0.690 | 0.602 | 0.593 | 0.597 | 0.664 | 0.650 | 0.633 | 0.745 | 0.755 | 0.775 | 0.734 |
| 2001 | 0.733 | 0.695 | 0.655 | 0.631 | 0.614 | 0.578 | 0.533 | 0.540 | 0.558 | 0.527 | 0.477 | NA |
| 2002 | 0.524 | 0.517 | 0.554 | 0.599 | 0.603 | 0.587 | 0.602 | 0.611 | 0.625 | 0.659 | 0.674 | NA |
| 2003 | 0.872 | 0.975 | 1.021 | 0.719 | 0.694 | 0.671 | 0.726 | 0.737 | 0.691 | 0.714 | 0.739 | 0.760 |
| 2004 | 0.812 | 0.774 | 0.717 | 0.691 | 0.785 | 0.778 | 0.735 | 0.760 | 0.757 | 0.825 | 0.860 | 0.841 |
| 2005 | 0.882 | 0.921 | 0.995 | 1.060 | 1.031 | 1.054 | 1.159 | 1.259 | 1.415 | 1.390 | 1.332 | 1.337 |
| 2006 | 1.346 | 1.373 | 1.344 | 1.362 | NA | 1.276 | 1.299 | 1.345 | 1.201 | 1.254 | 1.258 | 1.259 |
| 2007 | 1.232 | 1.282 | 1.314 | 1.311 | 1.370 | 1.415 | 1.481 | 1.514 | 1.564 | 1.730 | 1.986 | 2.027 |
| 2008 | 2.099 | 2.017 | 2.123 | 2.173 | 2.419 | 2.814 | 2.984 | 2.756 | NA | 1.859 | 1.487 | 1.213 |
| 2009 | 1.248 | 1.315 | 1.407 | 1.367 | 1.441 | 1.605 | 1.551 | 1.730 | 1.697 | 1.850 | 1.934 | 1.922 |
| 2010 | 2.043 | 1.938 | NA | 2.093 | NA | 1.901 | NA | 1.884 | 1.901 | 1.969 | 2.173 | NA |
| 2011 | 2.485 | 2.702 | - | - | - | - | - | - | - | - | - | - |
| 2012 | - | - | - | - | - | - | - | - | - | - | - | - |
| 2013 | - | - | - | - | - | - | - | - | - | - | - | - |
| 2014 | - | - | - | - | - | - | - | - | - | - | - | - |
| 2015 | - | - | - | - | - | - | - | - | - | - | - | - |
| 2016 | - | - | - | - | - | - | - | - | - | - | - | - |
| 2017 | - | - | - | - | - | - | - | - | - | - | - | - |
| 2018 | - | - | - | - | - | - | - | - | - | - | - | - |
| 2019 | - | - | - | - | - | - | - | - | - | - | - | - |
| 2020 | - | - | - | - | - | - | - | - | - | - | - | - |
| 2021 | - | - | - | - | - | - | - | - | - | - | - | - |
| 2022 | - | - | - | |||||||||
| - = No Data Reported; -- = Not Applicable; NA = Not Available; W = Withheld to avoid disclosure of individual company data. |
| Release Date: 6/1/2022 |
| Next Release Date: TBD |