|
Download Data (XLS File) |
|
||||||||
|
||||||||
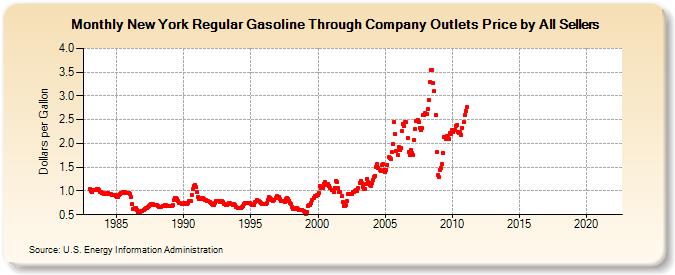
| New York Regular Gasoline Through Company Outlets Price by All Sellers (Dollars per Gallon) | ||||||||
| Year | Jan | Feb | Mar | Apr | May | Jun | Jul | Aug | Sep | Oct | Nov | Dec |
|---|---|---|---|---|---|---|---|---|---|---|---|---|
| 1983 | 1.043 | 1.000 | 0.975 | 1.018 | 1.014 | 1.016 | 1.044 | 1.037 | 1.010 | 0.981 | 0.974 | 0.960 |
| 1984 | 0.957 | 0.940 | 0.943 | 0.950 | 0.949 | 0.943 | 0.933 | 0.926 | 0.919 | 0.915 | 0.912 | 0.899 |
| 1985 | 0.878 | 0.880 | 0.906 | 0.935 | 0.949 | 0.963 | 0.971 | 0.971 | 0.959 | 0.957 | 0.956 | 0.954 |
| 1986 | 0.936 | 0.868 | 0.721 | 0.617 | 0.640 | 0.646 | 0.595 | 0.562 | 0.566 | 0.559 | 0.569 | 0.573 |
| 1987 | 0.605 | 0.629 | 0.639 | 0.650 | 0.662 | 0.692 | 0.708 | 0.725 | 0.719 | 0.712 | 0.711 | 0.702 |
| 1988 | 0.697 | 0.679 | 0.668 | 0.667 | 0.670 | 0.690 | 0.689 | 0.694 | 0.696 | 0.686 | 0.686 | 0.689 |
| 1989 | 0.687 | 0.684 | 0.704 | 0.807 | 0.862 | 0.858 | 0.841 | 0.791 | 0.748 | 0.738 | 0.718 | 0.718 |
| 1990 | 0.744 | 0.755 | 0.729 | 0.732 | 0.747 | 0.792 | 0.799 | 0.921 | 1.031 | 1.106 | 1.123 | 1.074 |
| 1991 | 0.971 | 0.880 | 0.829 | 0.833 | 0.852 | 0.843 | 0.824 | 0.818 | 0.819 | 0.788 | 0.792 | 0.765 |
| 1992 | 0.739 | 0.718 | 0.703 | 0.708 | 0.742 | 0.782 | 0.795 | 0.783 | 0.776 | 0.773 | 0.780 | 0.762 |
| 1993 | 0.734 | 0.715 | 0.705 | 0.714 | 0.739 | 0.738 | 0.734 | 0.726 | 0.713 | 0.718 | 0.703 | 0.668 |
| 1994 | 0.647 | 0.645 | 0.636 | 0.636 | 0.652 | 0.678 | 0.717 | 0.756 | 0.756 | 0.754 | 0.755 | 0.739 |
| 1995 | 0.717 | 0.707 | 0.699 | 0.714 | 0.778 | 0.807 | 0.799 | 0.779 | 0.763 | 0.738 | 0.716 | 0.723 |
| 1996 | 0.723 | 0.720 | 0.741 | 0.817 | 0.866 | 0.853 | 0.827 | 0.804 | 0.797 | 0.809 | 0.853 | 0.884 |
| 1997 | 0.882 | 0.872 | 0.823 | 0.793 | 0.785 | 0.786 | 0.776 | 0.832 | 0.862 | 0.831 | 0.796 | 0.757 |
| 1998 | 0.723 | 0.672 | 0.622 | 0.624 | 0.634 | 0.635 | 0.625 | 0.609 | 0.597 | 0.609 | 0.604 | 0.568 |
| 1999 | 0.541 | 0.513 | 0.552 | 0.676 | 0.707 | 0.700 | 0.742 | 0.813 | 0.862 | 0.890 | 0.893 | 0.910 |
| 2000 | 0.920 | 0.957 | 1.096 | 1.059 | 1.054 | 1.147 | 1.194 | 1.134 | 1.156 | 1.150 | 1.110 | 1.063 |
| 2001 | 1.028 | 1.018 | 0.985 | 1.069 | 1.219 | 1.183 | 1.055 | 0.980 | 0.977 | 0.885 | 0.767 | 0.684 |
| 2002 | 0.693 | 0.697 | 0.788 | 0.936 | 0.946 | 0.939 | 0.938 | 0.973 | 0.985 | 1.004 | 1.015 | 1.008 |
| 2003 | 1.060 | 1.171 | 1.218 | 1.177 | 1.086 | 1.033 | 1.040 | 1.145 | 1.252 | 1.180 | 1.121 | 1.109 |
| 2004 | 1.168 | 1.237 | 1.298 | 1.319 | 1.512 | 1.559 | 1.486 | 1.445 | 1.425 | 1.545 | 1.557 | 1.447 |
| 2005 | 1.400 | 1.442 | 1.552 | 1.710 | 1.683 | 1.680 | 1.815 | 1.981 | 2.450 | 2.193 | 1.836 | 1.763 |
| 2006 | 1.922 | 1.865 | 1.905 | 2.266 | 2.403 | 2.361 | 2.442 | 2.445 | 2.118 | 1.821 | 1.752 | 1.858 |
| 2007 | 1.797 | 1.758 | 2.079 | 2.298 | 2.477 | 2.502 | 2.460 | 2.321 | 2.279 | 2.328 | 2.594 | 2.607 |
| 2008 | 2.638 | 2.611 | 2.722 | 2.907 | 3.288 | 3.546 | 3.550 | 3.267 | 3.098 | 2.595 | 1.810 | 1.332 |
| 2009 | 1.297 | 1.451 | 1.482 | 1.557 | 1.798 | 2.128 | 2.088 | 2.148 | 2.117 | 2.096 | 2.210 | 2.188 |
| 2010 | 2.273 | 2.231 | 2.291 | 2.371 | 2.383 | 2.249 | 2.228 | 2.235 | 2.180 | 2.327 | 2.446 | 2.589 |
| 2011 | 2.680 | 2.758 | - | - | - | - | - | - | - | - | - | - |
| 2012 | - | - | - | - | - | - | - | - | - | - | - | - |
| 2013 | - | - | - | - | - | - | - | - | - | - | - | - |
| 2014 | - | - | - | - | - | - | - | - | - | - | - | - |
| 2015 | - | - | - | - | - | - | - | - | - | - | - | - |
| 2016 | - | - | - | - | - | - | - | - | - | - | - | - |
| 2017 | - | - | - | - | - | - | - | - | - | - | - | - |
| 2018 | - | - | - | - | - | - | - | - | - | - | - | - |
| 2019 | - | - | - | - | - | - | - | - | - | - | - | - |
| 2020 | - | - | - | - | - | - | - | - | - | - | - | - |
| 2021 | - | - | - | - | - | - | - | - | - | - | - | - |
| 2022 | - | - | - | |||||||||
| - = No Data Reported; -- = Not Applicable; NA = Not Available; W = Withheld to avoid disclosure of individual company data. |
| Release Date: 6/1/2022 |
| Next Release Date: TBD |