|
Download Data (XLS File) |
|
||||||||
|
||||||||
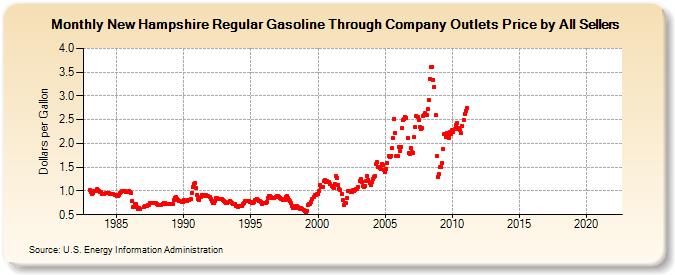
| New Hampshire Regular Gasoline Through Company Outlets Price by All Sellers (Dollars per Gallon) | ||||||||
| Year | Jan | Feb | Mar | Apr | May | Jun | Jul | Aug | Sep | Oct | Nov | Dec |
|---|---|---|---|---|---|---|---|---|---|---|---|---|
| 1983 | 1.022 | 0.977 | 0.936 | 0.967 | 0.993 | 1.005 | 1.032 | 1.010 | 1.003 | 0.984 | 0.969 | 0.944 |
| 1984 | 0.944 | 0.946 | 0.956 | 0.952 | 0.953 | 0.947 | 0.946 | 0.938 | 0.932 | 0.931 | 0.925 | 0.918 |
| 1985 | 0.902 | 0.896 | 0.916 | 0.949 | 0.978 | 0.989 | 1.007 | 0.989 | 0.982 | 0.979 | 0.987 | 0.991 |
| 1986 | 0.980 | 0.953 | 0.790 | 0.672 | 0.721 | 0.734 | 0.657 | 0.629 | 0.649 | 0.612 | NA | NA |
| 1987 | 0.656 | 0.679 | 0.678 | 0.687 | 0.696 | 0.714 | 0.742 | 0.753 | 0.742 | 0.737 | 0.741 | 0.739 |
| 1988 | 0.715 | 0.713 | 0.705 | 0.709 | 0.713 | 0.733 | 0.747 | 0.743 | 0.731 | 0.720 | 0.725 | 0.731 |
| 1989 | 0.729 | 0.724 | 0.734 | 0.807 | 0.862 | 0.865 | 0.838 | 0.802 | 0.789 | 0.783 | 0.771 | 0.770 |
| 1990 | 0.800 | 0.795 | 0.790 | 0.788 | 0.805 | 0.814 | 0.827 | 0.964 | 1.076 | 1.155 | 1.170 | 1.064 |
| 1991 | 0.924 | 0.827 | 0.818 | 0.873 | 0.916 | 0.918 | 0.900 | 0.910 | 0.913 | 0.894 | 0.891 | 0.873 |
| 1992 | 0.837 | 0.795 | 0.756 | 0.751 | 0.795 | 0.847 | 0.850 | 0.839 | 0.836 | 0.830 | 0.824 | 0.806 |
| 1993 | 0.786 | 0.765 | 0.752 | 0.757 | 0.775 | 0.783 | 0.762 | 0.751 | 0.735 | 0.728 | 0.716 | 0.687 |
| 1994 | 0.667 | 0.678 | 0.673 | 0.682 | 0.691 | 0.727 | 0.753 | 0.796 | 0.795 | 0.781 | 0.784 | 0.764 |
| 1995 | 0.762 | 0.748 | 0.741 | 0.758 | 0.811 | 0.834 | 0.817 | 0.799 | 0.786 | 0.762 | 0.731 | 0.737 |
| 1996 | 0.751 | 0.742 | 0.771 | 0.850 | 0.902 | 0.892 | 0.868 | 0.843 | 0.843 | 0.846 | 0.870 | 0.898 |
| 1997 | 0.893 | 0.880 | 0.855 | 0.831 | 0.823 | 0.819 | 0.804 | 0.880 | 0.885 | 0.853 | 0.816 | 0.779 |
| 1998 | 0.743 | 0.690 | 0.640 | 0.649 | 0.673 | 0.673 | 0.660 | 0.637 | 0.628 | 0.639 | 0.627 | 0.602 |
| 1999 | 0.581 | 0.553 | 0.585 | 0.696 | 0.721 | 0.716 | 0.761 | 0.837 | 0.881 | 0.917 | 0.917 | 0.932 |
| 2000 | 0.942 | 0.993 | 1.126 | 1.076 | 1.092 | 1.204 | 1.222 | 1.188 | 1.203 | 1.189 | 1.183 | 1.138 |
| 2001 | 1.100 | 1.092 | 1.063 | 1.149 | 1.306 | 1.278 | 1.128 | 1.031 | 1.019 | 0.937 | 0.800 | 0.711 |
| 2002 | 0.743 | 0.749 | 0.857 | 0.995 | 0.994 | 0.970 | 0.980 | 1.012 | 1.008 | 1.018 | 1.044 | 1.041 |
| 2003 | 1.088 | 1.217 | 1.248 | 1.178 | 1.107 | 1.086 | 1.106 | 1.211 | 1.315 | 1.237 | 1.163 | 1.124 |
| 2004 | 1.195 | 1.243 | 1.298 | 1.310 | 1.560 | 1.609 | 1.512 | 1.478 | 1.454 | 1.573 | 1.553 | 1.448 |
| 2005 | 1.407 | 1.468 | 1.596 | 1.728 | 1.708 | 1.737 | 1.901 | 2.110 | 2.524 | 2.224 | 1.744 | 1.731 |
| 2006 | 1.920 | 1.835 | 1.933 | 2.322 | 2.502 | 2.508 | 2.565 | 2.539 | 2.122 | 1.797 | 1.785 | 1.909 |
| 2007 | 1.818 | 1.803 | 2.126 | 2.347 | 2.582 | 2.555 | 2.500 | 2.356 | 2.294 | 2.318 | 2.586 | 2.606 |
| 2008 | 2.633 | 2.596 | 2.723 | 2.911 | 3.358 | 3.602 | 3.615 | 3.341 | 3.193 | 2.592 | 1.733 | 1.295 |
| 2009 | 1.353 | 1.494 | 1.507 | 1.598 | 1.873 | 2.195 | 2.133 | 2.219 | 2.179 | 2.121 | 2.231 | 2.201 |
| 2010 | 2.291 | 2.243 | 2.302 | 2.391 | 2.433 | 2.328 | 2.297 | 2.274 | 2.218 | 2.368 | 2.496 | 2.624 |
| 2011 | 2.691 | 2.755 | - | - | - | - | - | - | - | - | - | - |
| 2012 | - | - | - | - | - | - | - | - | - | - | - | - |
| 2013 | - | - | - | - | - | - | - | - | - | - | - | - |
| 2014 | - | - | - | - | - | - | - | - | - | - | - | - |
| 2015 | - | - | - | - | - | - | - | - | - | - | - | - |
| 2016 | - | - | - | - | - | - | - | - | - | - | - | - |
| 2017 | - | - | - | - | - | - | - | - | - | - | - | - |
| 2018 | - | - | - | - | - | - | - | - | - | - | - | - |
| 2019 | - | - | - | - | - | - | - | - | - | - | - | - |
| 2020 | - | - | - | - | - | - | - | - | - | - | - | - |
| 2021 | - | - | - | - | - | - | - | - | - | - | - | - |
| 2022 | - | - | - | |||||||||
| - = No Data Reported; -- = Not Applicable; NA = Not Available; W = Withheld to avoid disclosure of individual company data. |
| Release Date: 6/1/2022 |
| Next Release Date: TBD |