|
Download Data (XLS File) |
|
||||||||
|
||||||||
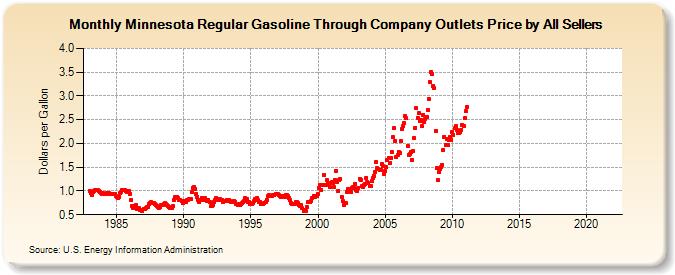
| Minnesota Regular Gasoline Through Company Outlets Price by All Sellers (Dollars per Gallon) | ||||||||
| Year | Jan | Feb | Mar | Apr | May | Jun | Jul | Aug | Sep | Oct | Nov | Dec |
|---|---|---|---|---|---|---|---|---|---|---|---|---|
| 1983 | 1.008 | 0.949 | 0.912 | 0.982 | 1.002 | 1.012 | 1.017 | 1.011 | 1.005 | 0.984 | 0.958 | 0.943 |
| 1984 | 0.949 | 0.946 | 0.943 | 0.957 | 0.963 | 0.954 | 0.946 | 0.940 | 0.939 | 0.936 | 0.928 | 0.901 |
| 1985 | 0.868 | 0.851 | 0.877 | 0.949 | 0.980 | 1.014 | 1.028 | 1.026 | 1.009 | 0.986 | 1.000 | 0.992 |
| 1986 | 0.944 | 0.815 | 0.684 | 0.639 | 0.692 | 0.710 | 0.626 | 0.626 | 0.639 | 0.609 | 0.595 | 0.588 |
| 1987 | 0.628 | 0.620 | 0.632 | 0.661 | 0.669 | 0.719 | 0.747 | 0.759 | 0.755 | 0.742 | 0.735 | 0.700 |
| 1988 | 0.681 | 0.657 | 0.648 | 0.668 | 0.701 | 0.702 | 0.721 | 0.738 | 0.716 | 0.696 | 0.685 | 0.658 |
| 1989 | 0.642 | 0.651 | 0.677 | 0.811 | 0.865 | 0.867 | 0.878 | 0.844 | 0.820 | 0.816 | 0.785 | 0.748 |
| 1990 | 0.793 | 0.788 | 0.761 | 0.802 | 0.819 | 0.830 | 0.828 | 0.971 | 1.069 | 1.084 | 1.046 | 0.937 |
| 1991 | 0.878 | 0.802 | 0.762 | 0.819 | 0.858 | 0.842 | 0.818 | 0.844 | 0.819 | 0.799 | 0.814 | 0.764 |
| 1992 | 0.678 | 0.689 | 0.714 | 0.770 | 0.818 | 0.855 | 0.838 | 0.813 | 0.821 | 0.820 | 0.810 | 0.763 |
| 1993 | 0.782 | 0.781 | 0.793 | 0.810 | 0.818 | 0.796 | 0.772 | 0.770 | 0.772 | 0.794 | 0.774 | 0.728 |
| 1994 | 0.711 | 0.718 | 0.704 | 0.716 | 0.738 | 0.758 | 0.796 | 0.849 | 0.829 | 0.769 | 0.759 | 0.718 |
| 1995 | 0.717 | 0.725 | 0.744 | 0.793 | 0.834 | 0.846 | 0.809 | 0.776 | 0.767 | 0.735 | 0.723 | 0.735 |
| 1996 | 0.753 | 0.766 | 0.815 | 0.884 | 0.909 | 0.900 | 0.886 | 0.900 | 0.911 | 0.909 | 0.933 | 0.935 |
| 1997 | 0.930 | 0.908 | 0.888 | 0.871 | 0.898 | 0.902 | 0.879 | 0.919 | 0.917 | 0.884 | 0.855 | 0.805 |
| 1998 | 0.745 | 0.723 | 0.721 | 0.730 | 0.763 | 0.763 | 0.736 | 0.701 | 0.691 | 0.694 | 0.631 | 0.585 |
| 1999 | 0.597 | 0.588 | 0.667 | 0.770 | 0.767 | 0.760 | 0.797 | 0.855 | 0.902 | 0.873 | 0.892 | 0.901 |
| 2000 | 0.942 | 1.070 | 1.119 | 1.022 | 1.129 | 1.344 | 1.122 | 1.130 | 1.226 | 1.170 | 1.139 | 1.083 |
| 2001 | 1.184 | 1.171 | 1.077 | 1.237 | 1.429 | 1.192 | 1.007 | 1.229 | 1.253 | 0.879 | 0.788 | 0.712 |
| 2002 | 0.748 | 0.740 | 0.968 | 1.047 | 1.002 | 0.987 | 1.070 | 1.080 | 1.065 | 1.154 | 1.021 | 0.992 |
| 2003 | 1.068 | 1.250 | 1.234 | 1.094 | 1.091 | 1.115 | 1.149 | 1.281 | 1.193 | 1.168 | 1.111 | 1.103 |
| 2004 | 1.207 | 1.264 | 1.323 | 1.404 | 1.609 | 1.475 | 1.457 | 1.437 | 1.449 | 1.564 | 1.515 | 1.362 |
| 2005 | 1.421 | 1.494 | 1.658 | 1.693 | 1.591 | 1.698 | 1.816 | 2.125 | 2.323 | 2.054 | 1.712 | 1.756 |
| 2006 | 1.826 | 1.796 | 2.042 | 2.308 | 2.357 | 2.429 | 2.576 | 2.528 | 1.942 | 1.767 | 1.778 | 1.811 |
| 2007 | 1.661 | 1.845 | 2.117 | 2.331 | 2.739 | 2.544 | 2.636 | 2.477 | 2.493 | 2.363 | 2.604 | 2.460 |
| 2008 | 2.523 | 2.563 | 2.702 | 2.944 | 3.287 | 3.504 | 3.458 | 3.215 | 3.156 | 2.271 | 1.477 | 1.226 |
| 2009 | 1.402 | 1.465 | 1.496 | 1.555 | 1.868 | 2.145 | 1.960 | 2.084 | 1.971 | 2.065 | 2.142 | 2.080 |
| 2010 | 2.239 | 2.180 | 2.318 | 2.360 | 2.286 | 2.216 | 2.216 | 2.232 | 2.289 | 2.387 | 2.376 | 2.529 |
| 2011 | 2.674 | 2.776 | - | - | - | - | - | - | - | - | - | - |
| 2012 | - | - | - | - | - | - | - | - | - | - | - | - |
| 2013 | - | - | - | - | - | - | - | - | - | - | - | - |
| 2014 | - | - | - | - | - | - | - | - | - | - | - | - |
| 2015 | - | - | - | - | - | - | - | - | - | - | - | - |
| 2016 | - | - | - | - | - | - | - | - | - | - | - | - |
| 2017 | - | - | - | - | - | - | - | - | - | - | - | - |
| 2018 | - | - | - | - | - | - | - | - | - | - | - | - |
| 2019 | - | - | - | - | - | - | - | - | - | - | - | - |
| 2020 | - | - | - | - | - | - | - | - | - | - | - | - |
| 2021 | - | - | - | - | - | - | - | - | - | - | - | - |
| 2022 | - | - | - | |||||||||
| - = No Data Reported; -- = Not Applicable; NA = Not Available; W = Withheld to avoid disclosure of individual company data. |
| Release Date: 6/1/2022 |
| Next Release Date: TBD |