|
Download Data (XLS File) |
|
||||||||
|
||||||||
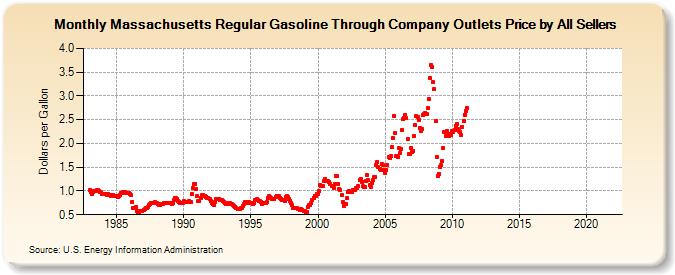
| Massachusetts Regular Gasoline Through Company Outlets Price by All Sellers (Dollars per Gallon) | ||||||||
| Year | Jan | Feb | Mar | Apr | May | Jun | Jul | Aug | Sep | Oct | Nov | Dec |
|---|---|---|---|---|---|---|---|---|---|---|---|---|
| 1983 | 1.014 | 0.976 | 0.939 | 0.970 | 1.005 | 1.006 | 1.014 | 1.011 | 1.004 | 0.986 | 0.968 | 0.945 |
| 1984 | 0.928 | 0.926 | 0.932 | 0.925 | 0.932 | 0.923 | 0.909 | 0.898 | 0.913 | 0.911 | 0.899 | 0.885 |
| 1985 | 0.895 | 0.879 | 0.895 | 0.921 | 0.952 | 0.963 | 0.975 | 0.972 | 0.961 | 0.965 | 0.961 | 0.964 |
| 1986 | 0.942 | 0.912 | 0.771 | 0.645 | 0.638 | 0.654 | 0.586 | 0.555 | 0.561 | 0.575 | 0.581 | 0.580 |
| 1987 | 0.602 | 0.620 | 0.638 | 0.651 | 0.670 | 0.704 | 0.732 | 0.754 | 0.757 | 0.750 | 0.758 | 0.747 |
| 1988 | 0.739 | 0.725 | 0.706 | 0.713 | 0.722 | 0.724 | 0.736 | 0.754 | 0.736 | 0.737 | 0.741 | 0.742 |
| 1989 | 0.737 | 0.734 | 0.739 | 0.800 | 0.851 | 0.846 | 0.828 | 0.799 | 0.778 | 0.752 | 0.754 | 0.753 |
| 1990 | 0.782 | 0.777 | 0.761 | 0.759 | 0.770 | 0.782 | 0.776 | 0.942 | 1.059 | 1.149 | 1.151 | 1.046 |
| 1991 | 0.892 | 0.787 | 0.788 | 0.854 | 0.905 | 0.913 | 0.889 | 0.891 | 0.881 | 0.852 | 0.854 | 0.830 |
| 1992 | 0.792 | 0.756 | 0.715 | 0.714 | 0.773 | 0.830 | 0.840 | 0.829 | 0.820 | 0.814 | 0.805 | 0.793 |
| 1993 | 0.770 | 0.748 | 0.732 | 0.718 | 0.740 | 0.748 | 0.733 | 0.721 | 0.700 | 0.691 | 0.672 | 0.636 |
| 1994 | 0.619 | 0.626 | 0.626 | 0.633 | 0.651 | 0.680 | 0.715 | 0.771 | 0.767 | 0.754 | 0.759 | 0.753 |
| 1995 | 0.744 | 0.740 | 0.726 | 0.741 | 0.800 | 0.823 | 0.813 | 0.798 | 0.786 | 0.769 | 0.735 | 0.742 |
| 1996 | 0.753 | 0.744 | 0.762 | 0.842 | 0.885 | 0.869 | 0.847 | 0.831 | 0.827 | 0.832 | 0.863 | 0.898 |
| 1997 | 0.898 | 0.885 | 0.853 | 0.834 | 0.815 | 0.809 | 0.797 | 0.864 | 0.891 | 0.867 | 0.835 | 0.797 |
| 1998 | 0.749 | 0.703 | 0.648 | 0.634 | 0.640 | 0.638 | 0.630 | 0.612 | 0.596 | 0.612 | 0.606 | 0.585 |
| 1999 | 0.568 | 0.542 | 0.562 | 0.672 | 0.702 | 0.699 | 0.747 | 0.819 | 0.862 | 0.897 | 0.904 | 0.929 |
| 2000 | 0.945 | 0.993 | 1.124 | 1.098 | 1.102 | 1.211 | 1.242 | 1.211 | 1.217 | 1.202 | 1.194 | 1.150 |
| 2001 | 1.114 | 1.096 | 1.063 | 1.153 | 1.325 | 1.310 | 1.154 | 1.038 | 1.010 | 0.909 | 0.778 | 0.688 |
| 2002 | 0.719 | 0.727 | 0.846 | 0.986 | 0.991 | 0.970 | 0.979 | 1.016 | 1.018 | 1.028 | 1.056 | 1.057 |
| 2003 | 1.094 | 1.221 | 1.255 | 1.186 | 1.094 | 1.073 | 1.081 | 1.202 | 1.330 | 1.226 | 1.128 | 1.091 |
| 2004 | 1.171 | 1.235 | 1.284 | 1.303 | 1.550 | 1.618 | 1.505 | 1.466 | 1.442 | 1.563 | 1.546 | 1.435 |
| 2005 | 1.385 | 1.451 | 1.555 | 1.720 | 1.703 | 1.730 | 1.915 | 2.111 | 2.575 | 2.217 | 1.736 | 1.711 |
| 2006 | 1.897 | 1.807 | 1.893 | 2.291 | 2.505 | 2.528 | 2.600 | 2.530 | 2.094 | 1.777 | 1.769 | 1.900 |
| 2007 | 1.826 | 1.838 | 2.162 | 2.381 | 2.582 | 2.564 | 2.497 | 2.329 | 2.272 | 2.304 | 2.602 | 2.621 |
| 2008 | 2.644 | 2.619 | 2.739 | 2.940 | 3.373 | 3.647 | 3.613 | 3.289 | 3.140 | 2.469 | 1.714 | 1.318 |
| 2009 | 1.362 | 1.511 | 1.537 | 1.628 | 1.907 | 2.237 | 2.153 | 2.258 | 2.203 | 2.150 | 2.204 | 2.174 |
| 2010 | 2.267 | 2.232 | 2.290 | 2.368 | 2.408 | 2.295 | 2.261 | 2.245 | 2.172 | 2.342 | 2.477 | 2.604 |
| 2011 | 2.687 | 2.754 | - | - | - | - | - | - | - | - | - | - |
| 2012 | - | - | - | - | - | - | - | - | - | - | - | - |
| 2013 | - | - | - | - | - | - | - | - | - | - | - | - |
| 2014 | - | - | - | - | - | - | - | - | - | - | - | - |
| 2015 | - | - | - | - | - | - | - | - | - | - | - | - |
| 2016 | - | - | - | - | - | - | - | - | - | - | - | - |
| 2017 | - | - | - | - | - | - | - | - | - | - | - | - |
| 2018 | - | - | - | - | - | - | - | - | - | - | - | - |
| 2019 | - | - | - | - | - | - | - | - | - | - | - | - |
| 2020 | - | - | - | - | - | - | - | - | - | - | - | - |
| 2021 | - | - | - | - | - | - | - | - | - | - | - | - |
| 2022 | - | - | - | |||||||||
| - = No Data Reported; -- = Not Applicable; NA = Not Available; W = Withheld to avoid disclosure of individual company data. |
| Release Date: 6/1/2022 |
| Next Release Date: TBD |