|
Download Data (XLS File) |
|
||||||||
|
||||||||
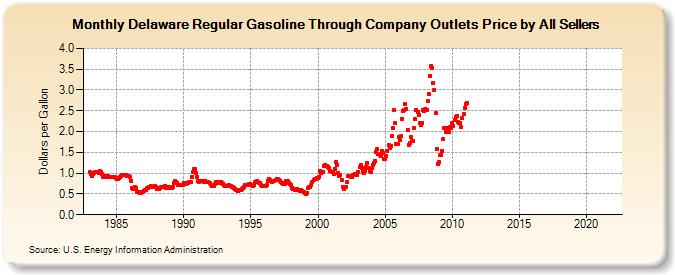
| Delaware Regular Gasoline Through Company Outlets Price by All Sellers (Dollars per Gallon) | ||||||||
| Year | Jan | Feb | Mar | Apr | May | Jun | Jul | Aug | Sep | Oct | Nov | Dec |
|---|---|---|---|---|---|---|---|---|---|---|---|---|
| 1983 | 1.024 | 0.984 | 0.943 | 0.977 | 1.006 | 1.033 | 1.036 | 1.030 | 1.011 | 1.040 | 1.027 | 0.984 |
| 1984 | 0.918 | 0.920 | 0.913 | 0.937 | 0.925 | 0.915 | 0.907 | 0.900 | 0.896 | 0.899 | 0.899 | 0.874 |
| 1985 | 0.853 | 0.866 | 0.884 | 0.906 | 0.936 | 0.945 | 0.955 | 0.960 | 0.957 | 0.936 | 0.936 | 0.934 |
| 1986 | 0.906 | 0.806 | 0.650 | 0.608 | 0.668 | 0.636 | 0.547 | 0.550 | 0.549 | 0.531 | 0.531 | 0.544 |
| 1987 | 0.576 | 0.600 | 0.602 | 0.634 | 0.650 | 0.659 | 0.677 | 0.683 | 0.675 | 0.673 | 0.684 | 0.662 |
| 1988 | 0.630 | 0.621 | 0.611 | 0.643 | 0.655 | 0.673 | 0.671 | 0.688 | 0.648 | 0.649 | 0.667 | 0.668 |
| 1989 | 0.650 | 0.648 | 0.672 | 0.752 | 0.799 | 0.783 | 0.758 | 0.721 | 0.723 | 0.719 | 0.706 | 0.717 |
| 1990 | 0.753 | 0.751 | 0.744 | 0.755 | 0.772 | 0.777 | 0.784 | 0.907 | 1.018 | 1.101 | 1.097 | 0.998 |
| 1991 | 0.897 | 0.813 | 0.787 | 0.811 | 0.821 | 0.807 | 0.796 | 0.811 | 0.798 | 0.780 | 0.786 | 0.759 |
| 1992 | 0.712 | 0.699 | 0.686 | 0.693 | 0.742 | 0.786 | 0.777 | 0.772 | 0.781 | 0.781 | 0.769 | 0.740 |
| 1993 | 0.721 | 0.702 | 0.697 | 0.697 | 0.710 | 0.702 | 0.685 | 0.673 | 0.656 | 0.647 | 0.616 | 0.594 |
| 1994 | 0.575 | 0.595 | 0.586 | 0.591 | 0.621 | 0.651 | 0.674 | 0.714 | 0.711 | 0.709 | 0.732 | 0.728 |
| 1995 | 0.720 | 0.713 | 0.702 | 0.709 | 0.782 | 0.803 | 0.788 | 0.769 | 0.752 | 0.720 | 0.692 | 0.696 |
| 1996 | 0.702 | 0.693 | 0.720 | 0.811 | 0.858 | 0.845 | 0.808 | 0.790 | 0.806 | 0.811 | 0.833 | 0.858 |
| 1997 | 0.855 | 0.836 | 0.804 | 0.775 | 0.758 | 0.748 | 0.735 | 0.800 | 0.821 | 0.799 | 0.769 | 0.739 |
| 1998 | 0.707 | 0.654 | 0.611 | 0.605 | 0.611 | 0.615 | 0.604 | 0.585 | 0.571 | 0.584 | 0.581 | 0.537 |
| 1999 | 0.513 | 0.494 | 0.532 | 0.632 | 0.667 | 0.658 | 0.720 | 0.798 | 0.833 | 0.863 | 0.867 | 0.878 |
| 2000 | 0.878 | 0.919 | 1.058 | 1.001 | 1.037 | 1.169 | 1.206 | 1.170 | 1.174 | 1.143 | 1.128 | 1.063 |
| 2001 | 1.031 | 1.022 | 0.977 | 1.098 | 1.272 | 1.207 | 1.004 | 0.935 | 0.959 | 0.831 | 0.678 | 0.620 |
| 2002 | 0.668 | 0.678 | 0.798 | 0.931 | 0.943 | 0.906 | 0.913 | 0.954 | 0.957 | 0.976 | 0.978 | 0.965 |
| 2003 | 1.035 | 1.153 | 1.187 | 1.114 | 1.029 | 1.014 | 1.040 | 1.149 | 1.233 | 1.130 | 1.048 | 1.032 |
| 2004 | 1.123 | 1.203 | 1.248 | 1.286 | 1.513 | 1.570 | 1.459 | 1.433 | 1.422 | 1.527 | 1.476 | 1.348 |
| 2005 | 1.339 | 1.417 | 1.522 | 1.678 | 1.607 | 1.658 | 1.891 | 2.077 | 2.508 | 2.207 | 1.695 | 1.693 |
| 2006 | 1.864 | 1.799 | 1.888 | 2.304 | 2.495 | 2.522 | 2.657 | 2.547 | 2.029 | 1.685 | 1.720 | 1.868 |
| 2007 | 1.771 | 1.764 | 2.074 | 2.296 | 2.530 | 2.461 | 2.403 | 2.194 | 2.168 | 2.200 | 2.507 | 2.486 |
| 2008 | 2.550 | 2.523 | 2.726 | 2.914 | 3.340 | 3.571 | 3.529 | 3.160 | 3.009 | 2.444 | 1.575 | 1.217 |
| 2009 | 1.262 | 1.430 | 1.448 | 1.541 | 1.810 | 2.093 | 1.997 | 2.093 | 2.034 | 1.989 | 2.120 | 2.090 |
| 2010 | 2.202 | 2.135 | 2.282 | 2.350 | 2.368 | 2.235 | 2.201 | 2.198 | 2.116 | 2.319 | 2.431 | 2.577 |
| 2011 | 2.671 | 2.691 | - | - | - | - | - | - | - | - | - | - |
| 2012 | - | - | - | - | - | - | - | - | - | - | - | - |
| 2013 | - | - | - | - | - | - | - | - | - | - | - | - |
| 2014 | - | - | - | - | - | - | - | - | - | - | - | - |
| 2015 | - | - | - | - | - | - | - | - | - | - | - | - |
| 2016 | - | - | - | - | - | - | - | - | - | - | - | - |
| 2017 | - | - | - | - | - | - | - | - | - | - | - | - |
| 2018 | - | - | - | - | - | - | - | - | - | - | - | - |
| 2019 | - | - | - | - | - | - | - | - | - | - | - | - |
| 2020 | - | - | - | - | - | - | - | - | - | - | - | - |
| 2021 | - | - | - | - | - | - | - | - | - | - | - | - |
| 2022 | - | - | - | |||||||||
| - = No Data Reported; -- = Not Applicable; NA = Not Available; W = Withheld to avoid disclosure of individual company data. |
| Release Date: 6/1/2022 |
| Next Release Date: TBD |