|
Download Data (XLS File) |
|
||||||||
|
||||||||
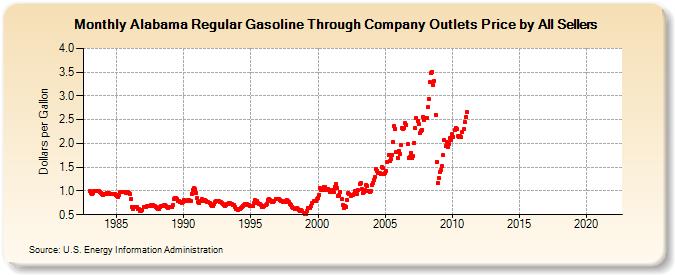
| Alabama Regular Gasoline Through Company Outlets Price by All Sellers (Dollars per Gallon) | ||||||||
| Year | Jan | Feb | Mar | Apr | May | Jun | Jul | Aug | Sep | Oct | Nov | Dec |
|---|---|---|---|---|---|---|---|---|---|---|---|---|
| 1983 | 0.995 | 0.958 | 0.931 | 0.958 | 0.991 | 0.992 | 0.997 | 0.992 | 0.990 | 0.978 | 0.961 | 0.931 |
| 1984 | 0.916 | 0.935 | 0.946 | 0.963 | 0.959 | 0.955 | 0.937 | 0.937 | 0.935 | 0.927 | 0.928 | 0.909 |
| 1985 | 0.884 | 0.878 | 0.915 | 0.977 | 0.979 | 0.985 | 0.981 | 0.969 | 0.959 | 0.956 | 0.968 | 0.957 |
| 1986 | 0.935 | 0.828 | 0.656 | 0.618 | 0.654 | 0.663 | 0.657 | 0.614 | 0.619 | 0.581 | 0.586 | 0.596 |
| 1987 | 0.657 | 0.665 | 0.666 | 0.679 | 0.682 | 0.690 | 0.693 | 0.706 | 0.701 | 0.686 | 0.680 | 0.663 |
| 1988 | 0.638 | 0.624 | 0.618 | 0.656 | 0.678 | 0.675 | 0.698 | 0.698 | 0.681 | 0.661 | 0.647 | 0.657 |
| 1989 | 0.671 | 0.658 | 0.698 | 0.837 | 0.859 | 0.843 | 0.828 | 0.798 | 0.792 | 0.773 | 0.746 | 0.761 |
| 1990 | 0.818 | 0.797 | 0.788 | 0.788 | 0.805 | 0.809 | 0.798 | 0.946 | 1.021 | 1.060 | 1.033 | 0.949 |
| 1991 | 0.853 | 0.770 | 0.749 | 0.787 | 0.822 | 0.813 | 0.795 | 0.801 | 0.795 | 0.773 | 0.767 | 0.745 |
| 1992 | 0.712 | 0.687 | 0.692 | 0.724 | 0.766 | 0.794 | 0.791 | 0.779 | 0.774 | 0.764 | 0.748 | 0.719 |
| 1993 | 0.701 | 0.687 | 0.696 | 0.734 | 0.750 | 0.743 | 0.728 | 0.721 | 0.702 | 0.697 | 0.658 | 0.618 |
| 1994 | 0.602 | 0.624 | 0.628 | 0.643 | 0.660 | 0.684 | 0.714 | 0.724 | 0.718 | 0.712 | 0.709 | 0.692 |
| 1995 | 0.684 | 0.678 | 0.684 | 0.745 | 0.803 | 0.798 | 0.756 | 0.729 | 0.716 | 0.695 | 0.664 | 0.666 |
| 1996 | 0.685 | 0.694 | 0.734 | 0.820 | 0.828 | 0.807 | 0.787 | 0.772 | 0.774 | 0.797 | 0.830 | 0.831 |
| 1997 | 0.833 | 0.828 | 0.806 | 0.797 | 0.787 | 0.775 | 0.767 | 0.796 | 0.801 | 0.781 | 0.759 | 0.735 |
| 1998 | 0.700 | 0.672 | 0.642 | 0.625 | 0.630 | 0.637 | 0.616 | 0.602 | 0.585 | 0.593 | 0.572 | 0.539 |
| 1999 | 0.523 | 0.516 | 0.569 | 0.645 | 0.641 | 0.633 | 0.688 | 0.738 | 0.783 | 0.783 | 0.791 | 0.824 |
| 2000 | 0.849 | 0.925 | 1.066 | 1.019 | 1.028 | 1.087 | 1.081 | 1.019 | 1.046 | 1.042 | 1.026 | 0.975 |
| 2001 | 0.996 | 1.022 | 0.981 | 1.087 | 1.141 | 1.059 | 0.891 | 0.918 | 0.985 | 0.830 | 0.696 | 0.635 |
| 2002 | 0.675 | 0.672 | 0.818 | 0.952 | 0.933 | 0.898 | 0.905 | 0.913 | 0.926 | 0.989 | 0.954 | 0.932 |
| 2003 | 1.010 | 1.145 | 1.158 | 1.037 | 0.953 | 0.973 | 1.027 | 1.128 | 1.101 | 1.008 | 0.983 | 0.990 |
| 2004 | 1.121 | 1.169 | 1.232 | 1.296 | 1.461 | 1.429 | 1.379 | 1.370 | 1.359 | 1.502 | 1.486 | 1.364 |
| 2005 | 1.378 | 1.414 | 1.601 | 1.755 | 1.634 | 1.664 | 1.765 | 2.032 | 2.361 | 2.313 | 1.812 | 1.694 |
| 2006 | 1.846 | 1.779 | 1.968 | 2.326 | 2.313 | 2.325 | 2.427 | 2.396 | 1.981 | 1.699 | 1.716 | 1.805 |
| 2007 | 1.684 | 1.734 | 2.011 | 2.320 | 2.536 | 2.470 | 2.403 | 2.211 | 2.257 | 2.288 | 2.562 | 2.487 |
| 2008 | 2.528 | 2.545 | 2.759 | 2.940 | 3.283 | 3.485 | 3.506 | 3.221 | 3.309 | 2.606 | 1.615 | 1.165 |
| 2009 | 1.269 | 1.403 | 1.433 | 1.520 | 1.753 | 2.071 | 1.951 | 2.038 | 1.929 | 1.997 | 2.115 | 2.076 |
| 2010 | 2.191 | 2.139 | 2.277 | 2.330 | 2.299 | 2.151 | 2.133 | 2.149 | 2.132 | 2.242 | 2.296 | 2.450 |
| 2011 | 2.556 | 2.659 | - | - | - | - | - | - | - | - | - | - |
| 2012 | - | - | - | - | - | - | - | - | - | - | - | - |
| 2013 | - | - | - | - | - | - | - | - | - | - | - | - |
| 2014 | - | - | - | - | - | - | - | - | - | - | - | - |
| 2015 | - | - | - | - | - | - | - | - | - | - | - | - |
| 2016 | - | - | - | - | - | - | - | - | - | - | - | - |
| 2017 | - | - | - | - | - | - | - | - | - | - | - | - |
| 2018 | - | - | - | - | - | - | - | - | - | - | - | - |
| 2019 | - | - | - | - | - | - | - | - | - | - | - | - |
| 2020 | - | - | - | - | - | - | - | - | - | - | - | - |
| 2021 | - | - | - | - | - | - | - | - | - | - | - | - |
| 2022 | - | - | - | |||||||||
| - = No Data Reported; -- = Not Applicable; NA = Not Available; W = Withheld to avoid disclosure of individual company data. |
| Release Date: 6/1/2022 |
| Next Release Date: TBD |