|
Download Data (XLS File) |
|
||||||||
|
||||||||
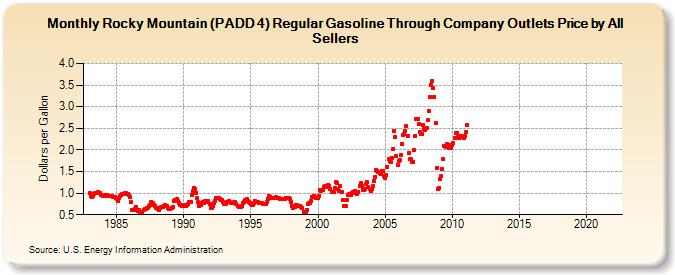
| Rocky Mountain (PADD 4) Regular Gasoline Through Company Outlets Price by All Sellers (Dollars per Gallon) | ||||||||
| Year | Jan | Feb | Mar | Apr | May | Jun | Jul | Aug | Sep | Oct | Nov | Dec |
|---|---|---|---|---|---|---|---|---|---|---|---|---|
| 1983 | 1.006 | 0.935 | 0.906 | 0.942 | 0.986 | 1.012 | 1.005 | 1.015 | 1.001 | 0.994 | 0.965 | 0.948 |
| 1984 | 0.935 | 0.939 | 0.949 | 0.947 | 0.940 | 0.933 | 0.927 | 0.928 | 0.928 | 0.919 | 0.914 | 0.894 |
| 1985 | 0.854 | 0.823 | 0.877 | 0.939 | 0.960 | 0.975 | 0.981 | 1.002 | 0.997 | 0.987 | 0.968 | 0.950 |
| 1986 | 0.899 | 0.786 | 0.616 | 0.616 | 0.642 | 0.688 | 0.620 | 0.597 | 0.605 | 0.560 | 0.574 | 0.568 |
| 1987 | 0.603 | 0.643 | 0.635 | 0.657 | 0.662 | 0.703 | 0.729 | 0.802 | 0.771 | 0.732 | 0.711 | 0.666 |
| 1988 | 0.651 | 0.627 | 0.616 | 0.653 | 0.687 | 0.685 | 0.697 | 0.723 | 0.708 | 0.694 | 0.655 | 0.625 |
| 1989 | 0.633 | 0.649 | 0.682 | 0.811 | 0.844 | 0.846 | 0.868 | 0.819 | 0.779 | 0.731 | 0.700 | 0.691 |
| 1990 | 0.720 | 0.699 | 0.695 | 0.722 | 0.741 | 0.788 | 0.787 | 0.964 | 1.047 | 1.119 | 1.093 | 1.006 |
| 1991 | 0.880 | 0.784 | 0.701 | 0.732 | 0.771 | 0.789 | 0.770 | 0.811 | 0.820 | 0.791 | 0.815 | 0.751 |
| 1992 | 0.664 | 0.665 | 0.710 | 0.770 | 0.828 | 0.885 | 0.894 | 0.883 | 0.871 | 0.846 | 0.844 | 0.790 |
| 1993 | 0.753 | 0.747 | 0.755 | 0.783 | 0.807 | 0.797 | 0.779 | 0.778 | 0.774 | 0.788 | 0.786 | 0.751 |
| 1994 | 0.691 | 0.689 | 0.677 | 0.674 | 0.708 | 0.762 | 0.796 | 0.849 | 0.857 | 0.816 | 0.799 | 0.774 |
| 1995 | 0.752 | 0.733 | 0.736 | 0.765 | 0.807 | 0.801 | 0.787 | 0.772 | 0.782 | 0.766 | 0.760 | 0.745 |
| 1996 | 0.744 | 0.751 | 0.787 | 0.872 | 0.932 | 0.906 | 0.885 | 0.887 | 0.894 | 0.897 | 0.909 | 0.890 |
| 1997 | 0.890 | 0.888 | 0.872 | 0.871 | 0.861 | 0.862 | 0.853 | 0.879 | 0.881 | 0.882 | 0.877 | 0.853 |
| 1998 | 0.790 | 0.706 | 0.656 | 0.682 | 0.718 | 0.735 | 0.713 | 0.701 | 0.692 | 0.686 | 0.654 | 0.574 |
| 1999 | 0.552 | 0.556 | 0.612 | 0.739 | 0.782 | 0.767 | 0.821 | 0.907 | 0.938 | 0.919 | 0.897 | 0.892 |
| 2000 | 0.877 | 0.936 | 1.079 | 1.056 | 1.065 | 1.152 | 1.165 | 1.133 | 1.166 | 1.192 | 1.166 | 1.088 |
| 2001 | 1.024 | 1.037 | 1.017 | 1.121 | 1.260 | 1.225 | 1.085 | 1.043 | 1.155 | 1.030 | 0.830 | 0.702 |
| 2002 | 0.707 | 0.709 | 0.852 | 0.964 | 0.975 | 0.961 | 1.005 | 1.026 | 1.007 | 1.047 | 1.029 | 0.971 |
| 2003 | 1.024 | 1.169 | 1.239 | 1.156 | 1.078 | 1.067 | 1.099 | 1.215 | 1.246 | 1.137 | 1.096 | 1.050 |
| 2004 | 1.096 | 1.153 | 1.286 | 1.384 | 1.535 | 1.517 | 1.477 | 1.466 | 1.449 | 1.518 | 1.511 | 1.405 |
| 2005 | 1.345 | 1.418 | 1.607 | 1.780 | 1.745 | 1.710 | 1.814 | 2.010 | 2.445 | 2.299 | 1.852 | 1.655 |
| 2006 | 1.752 | 1.774 | 1.885 | 2.137 | 2.351 | 2.370 | 2.445 | 2.546 | 2.330 | 1.935 | 1.781 | 1.780 |
| 2007 | 1.718 | 1.713 | 2.000 | 2.332 | 2.724 | 2.711 | 2.595 | 2.412 | 2.374 | 2.368 | 2.576 | 2.492 |
| 2008 | 2.458 | 2.512 | 2.686 | 2.897 | 3.227 | 3.510 | 3.602 | 3.438 | 3.235 | 2.614 | 1.575 | 1.095 |
| 2009 | 1.125 | 1.322 | 1.393 | 1.561 | 1.793 | 2.099 | 2.062 | 2.125 | 2.095 | 2.044 | 2.120 | 2.050 |
| 2010 | 2.122 | 2.153 | 2.265 | 2.392 | 2.402 | 2.298 | 2.276 | 2.318 | 2.332 | 2.296 | 2.286 | 2.311 |
| 2011 | 2.406 | 2.566 | - | - | - | - | - | - | - | - | - | - |
| 2012 | - | - | - | - | - | - | - | - | - | - | - | - |
| 2013 | - | - | - | - | - | - | - | - | - | - | - | - |
| 2014 | - | - | - | - | - | - | - | - | - | - | - | - |
| 2015 | - | - | - | - | - | - | - | - | - | - | - | - |
| 2016 | - | - | - | - | - | - | - | - | - | - | - | - |
| 2017 | - | - | - | - | - | - | - | - | - | - | - | - |
| 2018 | - | - | - | - | - | - | - | - | - | - | - | - |
| 2019 | - | - | - | - | - | - | - | - | - | - | - | - |
| 2020 | - | - | - | - | - | - | - | - | - | - | - | - |
| 2021 | - | - | - | - | - | - | - | - | - | - | - | - |
| 2022 | - | - | - | |||||||||
| - = No Data Reported; -- = Not Applicable; NA = Not Available; W = Withheld to avoid disclosure of individual company data. |
| Release Date: 6/1/2022 |
| Next Release Date: TBD |