|
Download Data (XLS File) |
|
||||||||
|
||||||||
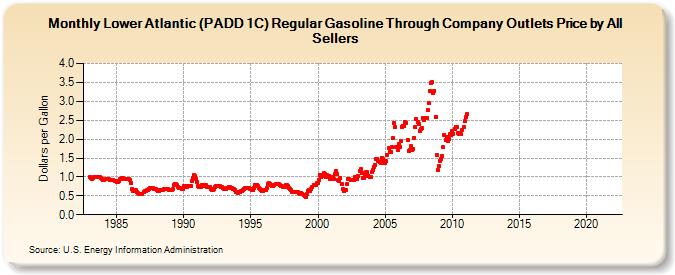
| Lower Atlantic (PADD 1C) Regular Gasoline Through Company Outlets Price by All Sellers (Dollars per Gallon) | ||||||||
| Year | Jan | Feb | Mar | Apr | May | Jun | Jul | Aug | Sep | Oct | Nov | Dec |
|---|---|---|---|---|---|---|---|---|---|---|---|---|
| 1983 | 1.001 | 0.967 | 0.936 | 0.967 | 0.997 | 1.003 | 1.002 | 0.996 | 0.993 | 0.986 | 0.970 | 0.946 |
| 1984 | 0.921 | 0.930 | 0.934 | 0.945 | 0.950 | 0.954 | 0.929 | 0.917 | 0.913 | 0.912 | 0.902 | 0.883 |
| 1985 | 0.869 | 0.861 | 0.901 | 0.947 | 0.957 | 0.958 | 0.958 | 0.956 | 0.942 | 0.941 | 0.948 | 0.950 |
| 1986 | 0.910 | 0.836 | 0.686 | 0.619 | 0.644 | 0.651 | 0.588 | 0.562 | 0.553 | 0.542 | 0.539 | 0.543 |
| 1987 | 0.600 | 0.622 | 0.631 | 0.646 | 0.657 | 0.679 | 0.695 | 0.705 | 0.698 | 0.691 | 0.689 | 0.668 |
| 1988 | 0.651 | 0.632 | 0.619 | 0.647 | 0.659 | 0.658 | 0.679 | 0.689 | 0.682 | 0.672 | 0.670 | 0.655 |
| 1989 | 0.644 | 0.641 | 0.671 | 0.788 | 0.816 | 0.803 | 0.781 | 0.739 | 0.707 | 0.700 | 0.685 | 0.686 |
| 1990 | 0.759 | 0.747 | 0.728 | 0.737 | 0.757 | 0.766 | 0.758 | 0.883 | 0.967 | 1.042 | 1.028 | 0.954 |
| 1991 | 0.856 | 0.761 | 0.725 | 0.746 | 0.790 | 0.786 | 0.761 | 0.774 | 0.775 | 0.745 | 0.743 | 0.720 |
| 1992 | 0.682 | 0.662 | 0.658 | 0.689 | 0.737 | 0.770 | 0.768 | 0.755 | 0.747 | 0.736 | 0.731 | 0.708 |
| 1993 | 0.689 | 0.678 | 0.680 | 0.707 | 0.726 | 0.728 | 0.715 | 0.696 | 0.678 | 0.671 | 0.648 | 0.606 |
| 1994 | 0.580 | 0.596 | 0.599 | 0.616 | 0.626 | 0.650 | 0.678 | 0.715 | 0.710 | 0.695 | 0.704 | 0.687 |
| 1995 | 0.669 | 0.660 | 0.653 | 0.701 | 0.777 | 0.783 | 0.747 | 0.710 | 0.688 | 0.666 | 0.637 | 0.636 |
| 1996 | 0.655 | 0.661 | 0.712 | 0.800 | 0.831 | 0.809 | 0.789 | 0.767 | 0.765 | 0.776 | 0.812 | 0.821 |
| 1997 | 0.821 | 0.807 | 0.783 | 0.766 | 0.752 | 0.744 | 0.730 | 0.777 | 0.774 | 0.749 | 0.719 | 0.686 |
| 1998 | 0.646 | 0.611 | 0.588 | 0.596 | 0.612 | 0.608 | 0.596 | 0.570 | 0.557 | 0.573 | 0.555 | 0.510 |
| 1999 | 0.496 | 0.480 | 0.536 | 0.637 | 0.646 | 0.640 | 0.689 | 0.744 | 0.776 | 0.782 | 0.798 | 0.827 |
| 2000 | 0.840 | 0.928 | 1.053 | 0.992 | 1.016 | 1.091 | 1.083 | 1.009 | 1.049 | 1.037 | 1.019 | 0.954 |
| 2001 | 0.987 | 1.004 | 0.948 | 1.071 | 1.144 | 1.069 | 0.905 | 0.895 | 0.960 | 0.815 | 0.676 | 0.617 |
| 2002 | 0.650 | 0.656 | 0.800 | 0.954 | 0.935 | 0.906 | 0.911 | 0.913 | 0.920 | 0.992 | 0.969 | 0.935 |
| 2003 | 1.011 | 1.158 | 1.197 | 1.094 | 0.983 | 0.982 | 1.024 | 1.119 | 1.123 | 1.036 | 1.002 | 0.996 |
| 2004 | 1.121 | 1.179 | 1.251 | 1.310 | 1.470 | 1.470 | 1.414 | 1.384 | 1.377 | 1.506 | 1.484 | 1.358 |
| 2005 | 1.364 | 1.420 | 1.589 | 1.759 | 1.657 | 1.666 | 1.781 | 2.027 | 2.435 | 2.320 | 1.798 | 1.702 |
| 2006 | 1.863 | 1.791 | 1.955 | 2.324 | 2.350 | 2.341 | 2.455 | 2.429 | 1.982 | 1.697 | 1.718 | 1.812 |
| 2007 | 1.707 | 1.734 | 2.035 | 2.323 | 2.532 | 2.463 | 2.403 | 2.218 | 2.258 | 2.284 | 2.562 | 2.501 |
| 2008 | 2.553 | 2.556 | 2.767 | 2.945 | 3.281 | 3.496 | 3.510 | 3.214 | 3.277 | 2.595 | 1.567 | 1.173 |
| 2009 | 1.295 | 1.420 | 1.463 | 1.548 | 1.783 | 2.104 | 1.982 | 2.058 | 1.948 | 2.013 | 2.129 | 2.101 |
| 2010 | 2.218 | 2.146 | 2.275 | 2.330 | 2.317 | 2.152 | 2.139 | 2.153 | 2.134 | 2.250 | 2.310 | 2.468 |
| 2011 | 2.577 | 2.659 | - | - | - | - | - | - | - | - | - | - |
| 2012 | - | - | - | - | - | - | - | - | - | - | - | - |
| 2013 | - | - | - | - | - | - | - | - | - | - | - | - |
| 2014 | - | - | - | - | - | - | - | - | - | - | - | - |
| 2015 | - | - | - | - | - | - | - | - | - | - | - | - |
| 2016 | - | - | - | - | - | - | - | - | - | - | - | - |
| 2017 | - | - | - | - | - | - | - | - | - | - | - | - |
| 2018 | - | - | - | - | - | - | - | - | - | - | - | - |
| 2019 | - | - | - | - | - | - | - | - | - | - | - | - |
| 2020 | - | - | - | - | - | - | - | - | - | - | - | - |
| 2021 | - | - | - | - | - | - | - | - | - | - | - | - |
| 2022 | - | - | - | |||||||||
| - = No Data Reported; -- = Not Applicable; NA = Not Available; W = Withheld to avoid disclosure of individual company data. |
| Release Date: 6/1/2022 |
| Next Release Date: TBD |