|
Download Data (XLS File) |
|
||||||||
|
||||||||
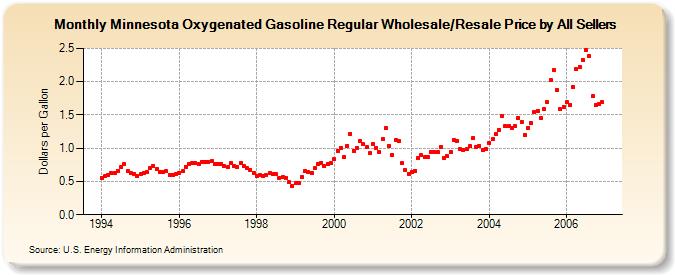
| Minnesota Oxygenated Gasoline Regular Wholesale/Resale Price by All Sellers (Dollars per Gallon) | ||||||||
| Year | Jan | Feb | Mar | Apr | May | Jun | Jul | Aug | Sep | Oct | Nov | Dec |
|---|---|---|---|---|---|---|---|---|---|---|---|---|
| 1994 | 0.558 | 0.578 | 0.592 | 0.620 | 0.633 | 0.663 | 0.712 | 0.759 | 0.664 | 0.625 | 0.619 | 0.585 |
| 1995 | 0.611 | 0.633 | 0.642 | 0.704 | 0.736 | 0.689 | 0.642 | 0.645 | 0.651 | 0.595 | 0.599 | 0.616 |
| 1996 | 0.632 | 0.653 | 0.722 | 0.768 | 0.774 | 0.777 | 0.763 | 0.798 | 0.798 | 0.792 | 0.805 | 0.763 |
| 1997 | 0.765 | 0.757 | 0.729 | 0.711 | 0.777 | 0.731 | 0.722 | 0.778 | 0.733 | 0.696 | 0.675 | 0.633 |
| 1998 | 0.587 | 0.594 | 0.584 | 0.600 | 0.627 | 0.614 | 0.605 | 0.559 | 0.562 | 0.557 | 0.486 | 0.432 |
| 1999 | 0.474 | 0.474 | 0.574 | 0.650 | 0.637 | 0.632 | 0.698 | 0.755 | 0.783 | 0.726 | 0.762 | 0.776 |
| 2000 | 0.832 | 0.963 | 1.010 | 0.863 | 1.037 | 1.217 | 0.965 | 1.004 | 1.110 | 1.056 | 1.014 | 0.921 |
| 2001 | 1.064 | 1.006 | 0.941 | 1.137 | 1.305 | 1.033 | 0.895 | 1.125 | 1.102 | 0.777 | 0.667 | 0.619 |
| 2002 | 0.649 | 0.662 | 0.855 | 0.891 | 0.863 | 0.869 | 0.946 | 0.950 | 0.946 | 1.018 | 0.858 | 0.882 |
| 2003 | 0.938 | 1.124 | 1.101 | 0.985 | 0.978 | 0.981 | 1.031 | 1.150 | 1.023 | 1.033 | 0.966 | 0.986 |
| 2004 | 1.080 | 1.132 | 1.207 | 1.279 | 1.489 | 1.327 | 1.335 | 1.306 | 1.326 | 1.460 | 1.397 | 1.202 |
| 2005 | 1.310 | 1.375 | 1.549 | 1.558 | 1.461 | 1.589 | 1.687 | 2.023 | 2.175 | 1.874 | 1.585 | 1.626 |
| 2006 | 1.687 | 1.654 | 1.925 | 2.186 | 2.223 | 2.328 | 2.475 | 2.380 | 1.778 | 1.651 | 1.669 | 1.688 |
| - = No Data Reported; -- = Not Applicable; NA = Not Available; W = Withheld to avoid disclosure of individual company data. |
| Release Date: 6/1/2022 |
| Next Release Date: TBD |