|
Download Data (XLS File) |
|
||||||||
|
||||||||
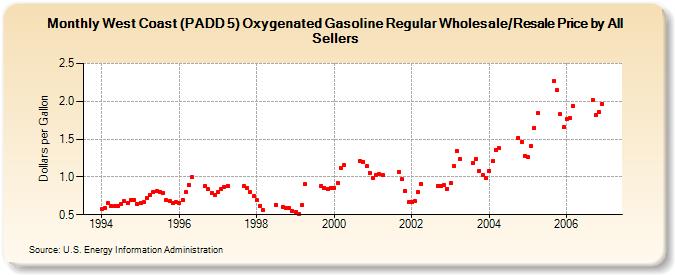
| West Coast (PADD 5) Oxygenated Gasoline Regular Wholesale/Resale Price by All Sellers (Dollars per Gallon) | ||||||||
| Year | Jan | Feb | Mar | Apr | May | Jun | Jul | Aug | Sep | Oct | Nov | Dec |
|---|---|---|---|---|---|---|---|---|---|---|---|---|
| 1994 | 0.573 | 0.587 | 0.652 | 0.617 | 0.613 | 0.618 | 0.648 | 0.675 | 0.650 | 0.701 | 0.700 | 0.647 |
| 1995 | 0.657 | 0.668 | 0.722 | 0.766 | 0.801 | 0.811 | 0.807 | 0.790 | 0.691 | 0.678 | 0.660 | 0.666 |
| 1996 | 0.660 | 0.695 | 0.797 | 0.895 | 0.999 | NA | NA | NA | 0.878 | 0.840 | 0.791 | 0.761 |
| 1997 | 0.799 | 0.839 | 0.872 | 0.884 | W | W | W | W | 0.876 | 0.851 | 0.801 | 0.744 |
| 1998 | 0.689 | 0.621 | 0.558 | W | W | W | 0.635 | W | 0.608 | 0.595 | 0.585 | 0.554 |
| 1999 | 0.538 | 0.508 | 0.627 | 0.904 | W | W | W | W | 0.885 | 0.852 | 0.845 | 0.853 |
| 2000 | 0.859 | 0.919 | 1.124 | 1.154 | W | W | W | W | 1.210 | 1.203 | 1.141 | 1.058 |
| 2001 | 0.987 | 1.021 | 1.038 | 1.026 | W | W | W | W | 1.069 | 0.967 | 0.814 | 0.663 |
| 2002 | 0.663 | 0.675 | 0.797 | 0.907 | W | W | W | W | 0.882 | 0.880 | 0.890 | 0.845 |
| 2003 | 0.913 | 1.141 | 1.346 | 1.238 | W | W | W | 1.189 | 1.237 | 1.076 | 1.020 | 0.982 |
| 2004 | 1.080 | 1.204 | 1.353 | 1.382 | NA | NA | NA | NA | NA | 1.518 | 1.465 | 1.280 |
| 2005 | 1.257 | 1.412 | 1.653 | 1.840 | W | W | W | W | 2.266 | 2.145 | 1.826 | 1.655 |
| 2006 | 1.764 | 1.780 | 1.938 | NA | W | - | - | - | 2.019 | 1.819 | 1.862 | 1.964 |
| - = No Data Reported; -- = Not Applicable; NA = Not Available; W = Withheld to avoid disclosure of individual company data. |
| Release Date: 6/1/2022 |
| Next Release Date: TBD |