|
Download Data (XLS File) |
|
||||||||
|
||||||||
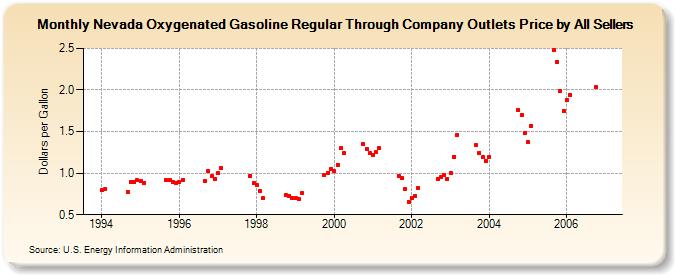
| Nevada Oxygenated Gasoline Regular Through Company Outlets Price by All Sellers (Dollars per Gallon) | ||||||||
| Year | Jan | Feb | Mar | Apr | May | Jun | Jul | Aug | Sep | Oct | Nov | Dec |
|---|---|---|---|---|---|---|---|---|---|---|---|---|
| 1994 | 0.800 | 0.809 | W | W | W | W | W | W | 0.774 | 0.891 | 0.891 | 0.913 |
| 1995 | 0.903 | 0.886 | NA | W | - | - | - | - | 0.917 | 0.912 | 0.892 | 0.882 |
| 1996 | 0.898 | 0.921 | NA | W | - | - | - | - | 0.901 | 1.020 | 0.965 | 0.935 |
| 1997 | 1.004 | 1.063 | W | - | - | - | - | - | W | NA | 0.967 | 0.882 |
| 1998 | 0.863 | 0.785 | 0.696 | W | - | - | - | - | W | 0.739 | 0.724 | 0.700 |
| 1999 | 0.701 | 0.684 | 0.757 | - | - | - | - | - | W | 0.976 | 1.006 | 1.049 |
| 2000 | 1.021 | 1.098 | 1.297 | 1.242 | - | - | - | - | W | 1.345 | 1.290 | 1.240 |
| 2001 | 1.216 | 1.253 | 1.298 | W | - | - | - | - | 0.965 | 0.936 | 0.806 | 0.658 |
| 2002 | 0.705 | 0.725 | 0.827 | W | - | - | - | - | 0.927 | 0.948 | 0.980 | 0.930 |
| 2003 | 1.005 | 1.198 | 1.461 | W | - | - | - | - | 1.334 | 1.246 | 1.188 | 1.149 |
| 2004 | 1.191 | W | W | W | - | - | - | - | W | 1.761 | 1.700 | 1.477 |
| 2005 | 1.371 | 1.570 | W | W | - | - | - | - | 2.475 | 2.341 | 1.992 | 1.750 |
| 2006 | 1.882 | 1.944 | W | - | - | - | - | - | W | 2.031 | NA | NA |
| - = No Data Reported; -- = Not Applicable; NA = Not Available; W = Withheld to avoid disclosure of individual company data. |
| Release Date: 6/1/2022 |
| Next Release Date: TBD |