|
Download Data (XLS File) |
|
||||||||
|
||||||||
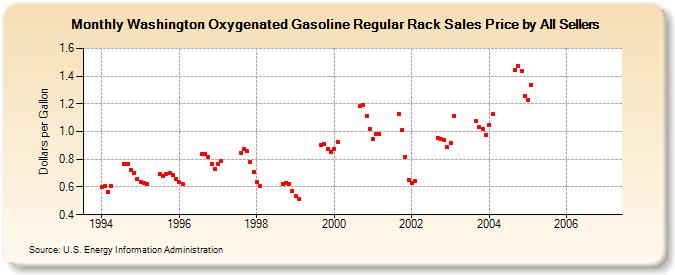
| Washington Oxygenated Gasoline Regular Rack Sales Price by All Sellers (Dollars per Gallon) | ||||||||
| Year | Jan | Feb | Mar | Apr | May | Jun | Jul | Aug | Sep | Oct | Nov | Dec |
|---|---|---|---|---|---|---|---|---|---|---|---|---|
| 1994 | 0.601 | 0.609 | 0.563 | 0.606 | - | - | W | 0.768 | 0.768 | 0.726 | 0.703 | 0.658 |
| 1995 | 0.633 | 0.631 | 0.619 | W | W | NA | 0.697 | 0.682 | 0.695 | 0.698 | 0.685 | 0.659 |
| 1996 | 0.638 | 0.623 | W | W | W | W | W | 0.840 | 0.841 | 0.814 | 0.765 | 0.732 |
| 1997 | 0.763 | 0.787 | W | W | W | W | W | 0.848 | 0.871 | 0.857 | 0.778 | 0.707 |
| 1998 | 0.639 | 0.607 | W | W | W | W | W | W | 0.621 | 0.632 | 0.622 | 0.570 |
| 1999 | 0.533 | 0.510 | W | W | W | W | W | W | 0.904 | 0.908 | 0.875 | 0.849 |
| 2000 | 0.873 | 0.928 | W | W | W | W | W | W | 1.184 | 1.193 | 1.110 | 1.016 |
| 2001 | 0.945 | 0.981 | 0.979 | W | W | W | W | W | 1.130 | 1.008 | 0.820 | 0.653 |
| 2002 | 0.630 | 0.642 | W | W | W | W | W | W | 0.952 | 0.944 | 0.937 | 0.888 |
| 2003 | 0.914 | 1.109 | W | W | W | W | W | W | 1.074 | 1.031 | 1.016 | 0.976 |
| 2004 | 1.049 | 1.124 | W | W | NA | NA | NA | NA | 1.447 | 1.473 | 1.434 | 1.259 |
| 2005 | 1.226 | 1.339 | - | - | - | - | - | - | - | - | - | - |
| 2006 | - | - | - | - | - | - | - | - | - | - | - | - |
| - = No Data Reported; -- = Not Applicable; NA = Not Available; W = Withheld to avoid disclosure of individual company data. |
| Release Date: 6/1/2022 |
| Next Release Date: TBD |