|
Download Data (XLS File) |
|
||||||||
|
||||||||
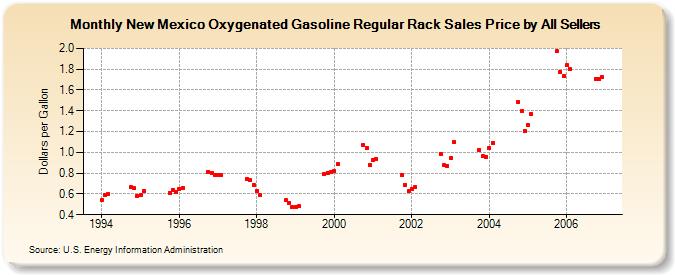
| New Mexico Oxygenated Gasoline Regular Rack Sales Price by All Sellers (Dollars per Gallon) | ||||||||
| Year | Jan | Feb | Mar | Apr | May | Jun | Jul | Aug | Sep | Oct | Nov | Dec |
|---|---|---|---|---|---|---|---|---|---|---|---|---|
| 1994 | 0.541 | 0.586 | 0.604 | W | - | - | - | - | - | 0.666 | 0.653 | 0.584 |
| 1995 | 0.589 | 0.628 | - | - | - | - | - | - | - | 0.612 | 0.641 | 0.621 |
| 1996 | 0.649 | 0.661 | - | - | - | - | - | - | - | 0.814 | 0.804 | 0.782 |
| 1997 | 0.781 | 0.779 | W | - | - | - | - | - | - | 0.743 | 0.731 | 0.687 |
| 1998 | 0.629 | 0.587 | W | - | - | - | - | - | - | 0.538 | 0.517 | 0.474 |
| 1999 | 0.475 | 0.480 | NA | W | - | - | - | - | - | 0.790 | 0.806 | 0.810 |
| 2000 | 0.820 | 0.887 | W | - | - | - | - | - | - | 1.071 | 1.042 | 0.879 |
| 2001 | 0.926 | 0.935 | W | - | - | - | - | - | - | 0.786 | 0.688 | 0.627 |
| 2002 | 0.651 | 0.662 | W | - | - | - | - | - | - | 0.987 | 0.875 | 0.871 |
| 2003 | 0.945 | 1.103 | - | - | - | - | - | - | - | 1.025 | 0.966 | 0.960 |
| 2004 | 1.044 | 1.092 | W | - | - | W | W | - | - | 1.485 | 1.397 | 1.209 |
| 2005 | 1.267 | 1.367 | W | - | - | - | W | W | - | 1.974 | 1.777 | 1.734 |
| 2006 | 1.836 | 1.805 | - | - | - | - | - | - | - | 1.707 | 1.701 | 1.720 |
| - = No Data Reported; -- = Not Applicable; NA = Not Available; W = Withheld to avoid disclosure of individual company data. |
| Release Date: 6/1/2022 |
| Next Release Date: TBD |