|
Download Data (XLS File) |
|
||||||||
|
||||||||
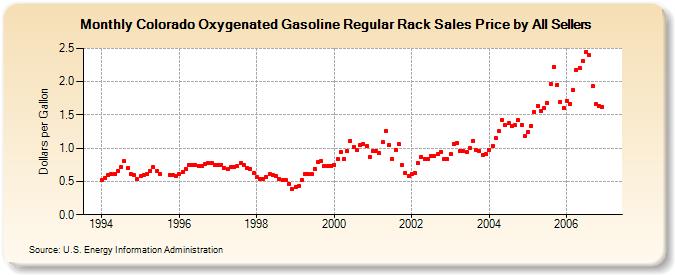
| Colorado Oxygenated Gasoline Regular Rack Sales Price by All Sellers (Dollars per Gallon) | ||||||||
| Year | Jan | Feb | Mar | Apr | May | Jun | Jul | Aug | Sep | Oct | Nov | Dec |
|---|---|---|---|---|---|---|---|---|---|---|---|---|
| 1994 | 0.522 | 0.558 | 0.591 | 0.609 | 0.619 | 0.655 | 0.713 | 0.800 | 0.702 | 0.615 | 0.596 | 0.533 |
| 1995 | 0.578 | 0.602 | 0.613 | 0.659 | 0.711 | 0.660 | 0.613 | NA | W | 0.602 | 0.591 | 0.582 |
| 1996 | 0.614 | 0.636 | 0.685 | 0.754 | 0.745 | 0.750 | 0.727 | 0.737 | 0.762 | 0.771 | 0.782 | 0.746 |
| 1997 | 0.749 | 0.752 | 0.704 | 0.680 | 0.714 | 0.715 | 0.727 | 0.776 | 0.746 | 0.709 | 0.690 | 0.626 |
| 1998 | 0.561 | 0.533 | 0.543 | 0.573 | 0.608 | 0.593 | 0.581 | 0.538 | 0.517 | 0.517 | 0.460 | 0.383 |
| 1999 | 0.415 | 0.430 | 0.524 | 0.612 | 0.607 | 0.612 | 0.693 | 0.788 | 0.805 | 0.738 | 0.732 | 0.736 |
| 2000 | 0.751 | 0.831 | 0.940 | 0.836 | 0.951 | 1.106 | 1.022 | 0.973 | 1.050 | 1.063 | 1.029 | 0.872 |
| 2001 | 0.953 | 0.957 | 0.925 | 1.087 | 1.261 | 1.047 | 0.835 | 0.979 | 1.057 | 0.748 | 0.630 | 0.586 |
| 2002 | 0.619 | 0.625 | 0.772 | 0.864 | 0.841 | 0.830 | 0.890 | 0.889 | 0.908 | 0.949 | 0.831 | 0.840 |
| 2003 | 0.906 | 1.065 | 1.079 | 0.959 | 0.953 | 0.938 | 0.996 | 1.112 | 0.979 | 0.960 | 0.903 | 0.906 |
| 2004 | 0.980 | 1.031 | 1.146 | 1.255 | 1.431 | 1.342 | 1.376 | 1.330 | 1.343 | 1.422 | 1.349 | 1.176 |
| 2005 | 1.243 | 1.334 | 1.546 | 1.640 | 1.553 | 1.601 | 1.678 | 1.968 | 2.225 | 1.954 | 1.700 | 1.606 |
| 2006 | 1.712 | 1.671 | 1.871 | 2.179 | 2.211 | 2.306 | 2.443 | 2.394 | 1.930 | 1.658 | 1.631 | 1.621 |
| - = No Data Reported; -- = Not Applicable; NA = Not Available; W = Withheld to avoid disclosure of individual company data. |
| Release Date: 6/1/2022 |
| Next Release Date: TBD |