|
Download Data (XLS File) |
|
||||||||
|
||||||||
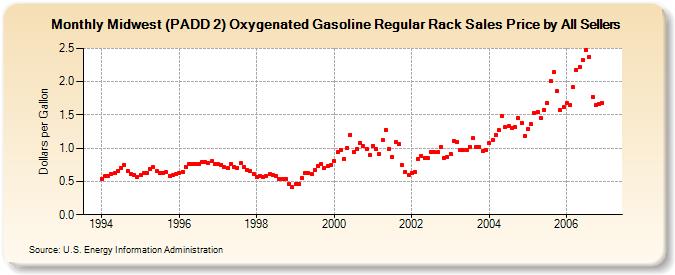
| Midwest (PADD 2) Oxygenated Gasoline Regular Rack Sales Price by All Sellers (Dollars per Gallon) | ||||||||
| Year | Jan | Feb | Mar | Apr | May | Jun | Jul | Aug | Sep | Oct | Nov | Dec |
|---|---|---|---|---|---|---|---|---|---|---|---|---|
| 1994 | 0.539 | 0.577 | 0.589 | 0.614 | 0.626 | 0.657 | 0.707 | 0.754 | 0.659 | 0.612 | 0.604 | 0.572 |
| 1995 | 0.603 | 0.624 | 0.630 | 0.689 | 0.719 | 0.661 | 0.622 | 0.630 | 0.637 | 0.588 | 0.594 | 0.608 |
| 1996 | 0.624 | 0.648 | 0.714 | 0.759 | 0.765 | 0.768 | 0.757 | 0.792 | 0.791 | 0.781 | 0.802 | 0.755 |
| 1997 | 0.758 | 0.752 | 0.717 | 0.699 | 0.769 | 0.716 | 0.708 | 0.772 | 0.715 | 0.678 | 0.656 | 0.614 |
| 1998 | 0.569 | 0.580 | 0.560 | 0.576 | 0.606 | 0.594 | 0.588 | 0.537 | 0.543 | 0.538 | 0.465 | 0.411 |
| 1999 | 0.458 | 0.456 | 0.553 | 0.627 | 0.620 | 0.612 | 0.679 | 0.732 | 0.763 | 0.702 | 0.735 | 0.754 |
| 2000 | 0.807 | 0.938 | 0.980 | 0.839 | 1.009 | 1.204 | 0.946 | 0.991 | 1.085 | 1.028 | 0.989 | 0.899 |
| 2001 | 1.039 | 0.986 | 0.917 | 1.116 | 1.278 | 0.993 | 0.868 | 1.091 | 1.068 | 0.750 | 0.646 | 0.598 |
| 2002 | 0.627 | 0.640 | 0.837 | 0.884 | 0.857 | 0.858 | 0.941 | 0.940 | 0.936 | 1.015 | 0.849 | 0.865 |
| 2003 | 0.916 | 1.107 | 1.092 | 0.977 | 0.970 | 0.977 | 1.024 | 1.148 | 1.022 | 1.024 | 0.953 | 0.972 |
| 2004 | 1.072 | 1.123 | 1.196 | 1.266 | 1.482 | 1.312 | 1.329 | 1.296 | 1.322 | 1.450 | 1.383 | 1.185 |
| 2005 | 1.292 | 1.357 | 1.535 | 1.543 | 1.451 | 1.581 | 1.678 | 2.013 | 2.140 | 1.856 | 1.573 | 1.612 |
| 2006 | 1.675 | 1.643 | 1.913 | 2.181 | 2.219 | 2.323 | 2.475 | 2.378 | 1.776 | 1.648 | 1.663 | 1.683 |
| - = No Data Reported; -- = Not Applicable; NA = Not Available; W = Withheld to avoid disclosure of individual company data. |
| Release Date: 6/1/2022 |
| Next Release Date: TBD |