|
Download Data (XLS File) |
|
||||||||
|
||||||||
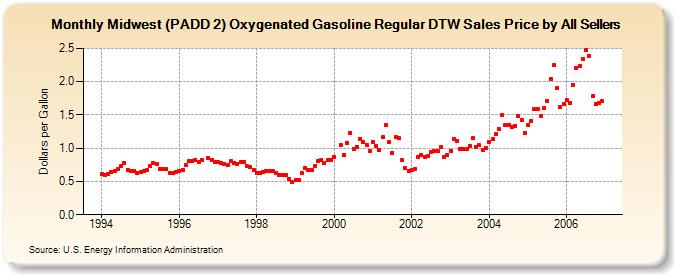
| Midwest (PADD 2) Oxygenated Gasoline Regular DTW Sales Price by All Sellers (Dollars per Gallon) | ||||||||
| Year | Jan | Feb | Mar | Apr | May | Jun | Jul | Aug | Sep | Oct | Nov | Dec |
|---|---|---|---|---|---|---|---|---|---|---|---|---|
| 1994 | 0.609 | 0.596 | 0.613 | 0.639 | 0.656 | 0.689 | 0.732 | 0.781 | 0.678 | 0.663 | 0.662 | 0.620 |
| 1995 | 0.640 | 0.657 | 0.669 | 0.739 | 0.778 | 0.756 | 0.693 | 0.683 | 0.687 | 0.631 | 0.620 | 0.642 |
| 1996 | 0.663 | 0.673 | 0.749 | 0.806 | 0.812 | 0.817 | 0.791 | 0.827 | W | 0.852 | 0.820 | 0.799 |
| 1997 | 0.793 | 0.780 | 0.763 | 0.751 | 0.801 | 0.782 | 0.767 | 0.798 | 0.795 | 0.728 | 0.715 | 0.677 |
| 1998 | 0.629 | 0.625 | 0.642 | 0.656 | 0.664 | 0.655 | 0.634 | 0.599 | 0.598 | 0.598 | 0.534 | 0.485 |
| 1999 | 0.518 | 0.521 | 0.623 | 0.702 | 0.674 | 0.675 | 0.738 | 0.803 | 0.827 | 0.778 | 0.818 | 0.826 |
| 2000 | 0.862 | NA | 1.048 | 0.894 | 1.072 | 1.234 | 0.990 | 1.022 | 1.143 | 1.091 | 1.047 | 0.953 |
| 2001 | 1.096 | 1.032 | 0.975 | 1.166 | 1.341 | 1.094 | 0.932 | 1.167 | 1.150 | 0.815 | 0.698 | 0.651 |
| 2002 | 0.679 | 0.692 | 0.874 | 0.897 | 0.868 | 0.880 | 0.950 | 0.959 | 0.955 | 1.019 | 0.865 | 0.899 |
| 2003 | 0.960 | 1.142 | 1.111 | 0.994 | 0.986 | 0.986 | 1.038 | 1.150 | 1.024 | 1.041 | 0.978 | 1.000 |
| 2004 | 1.088 | 1.141 | 1.218 | 1.293 | 1.495 | 1.347 | 1.343 | 1.317 | 1.332 | 1.478 | 1.421 | 1.232 |
| 2005 | 1.343 | 1.409 | 1.582 | 1.591 | 1.480 | 1.604 | 1.705 | 2.046 | 2.249 | 1.912 | 1.619 | 1.667 |
| 2006 | 1.721 | 1.686 | 1.957 | 2.208 | 2.235 | 2.344 | 2.473 | 2.383 | 1.783 | 1.658 | 1.686 | 1.705 |
| - = No Data Reported; -- = Not Applicable; NA = Not Available; W = Withheld to avoid disclosure of individual company data. |
| Release Date: 6/1/2022 |
| Next Release Date: TBD |