|
Download Data (XLS File) |
|
||||||||
|
||||||||
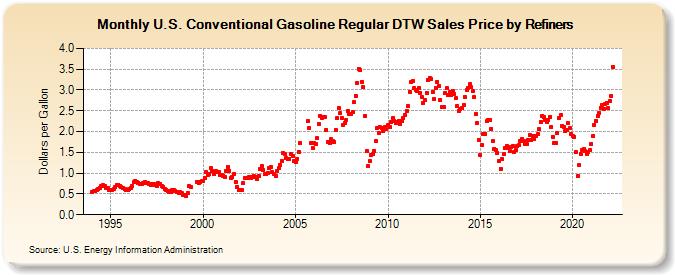
| U.S. Conventional Gasoline Regular DTW Sales Price by Refiners (Dollars per Gallon) | ||||||||
| Year | Jan | Feb | Mar | Apr | May | Jun | Jul | Aug | Sep | Oct | Nov | Dec |
|---|---|---|---|---|---|---|---|---|---|---|---|---|
| 1994 | 0.542 | 0.570 | 0.574 | 0.601 | 0.620 | 0.653 | 0.680 | 0.712 | 0.686 | 0.646 | 0.642 | 0.583 |
| 1995 | 0.595 | 0.606 | 0.610 | 0.663 | 0.725 | 0.725 | 0.684 | 0.655 | 0.651 | 0.607 | 0.583 | 0.604 |
| 1996 | 0.618 | 0.634 | 0.691 | 0.775 | 0.821 | 0.790 | 0.764 | 0.743 | 0.747 | 0.757 | 0.782 | 0.763 |
| 1997 | 0.767 | 0.749 | 0.724 | 0.731 | 0.734 | 0.721 | 0.697 | 0.758 | 0.744 | 0.702 | 0.669 | 0.623 |
| 1998 | 0.595 | 0.565 | 0.538 | 0.555 | 0.590 | 0.584 | 0.573 | 0.545 | 0.532 | 0.543 | 0.514 | 0.463 |
| 1999 | 0.465 | 0.443 | 0.524 | 0.680 | 0.674 | W | W | W | 0.794 | 0.767 | 0.782 | 0.799 |
| 2000 | 0.815 | 0.892 | 1.018 | 0.965 | 0.991 | 1.120 | 1.061 | 0.974 | 1.048 | 1.029 | 1.016 | 0.945 |
| 2001 | 0.951 | 0.942 | 0.912 | 1.040 | 1.155 | 1.059 | 0.892 | 0.898 | 0.980 | 0.796 | 0.668 | 0.589 |
| 2002 | 0.605 | 0.606 | 0.754 | 0.887 | 0.885 | 0.886 | 0.902 | 0.894 | 0.895 | 0.937 | 0.900 | 0.869 |
| 2003 | 0.943 | 1.108 | 1.161 | 1.079 | 0.978 | 0.985 | 0.996 | 1.125 | 1.148 | 1.027 | 0.975 | 0.942 |
| 2004 | 1.060 | 1.121 | 1.202 | 1.294 | 1.486 | 1.450 | 1.368 | 1.343 | 1.350 | 1.461 | 1.422 | 1.286 |
| 2005 | 1.271 | 1.347 | 1.517 | 1.719 | W | W | W | W | 2.251 | 2.091 | 1.723 | 1.613 |
| 2006 | 1.726 | 1.693 | 1.833 | 2.181 | 2.386 | 2.331 | 2.354 | 2.345 | 2.040 | 1.755 | 1.729 | 1.815 |
| 2007 | 1.761 | 1.749 | 2.048 | 2.322 | 2.565 | 2.438 | 2.327 | 2.168 | 2.209 | 2.274 | 2.502 | 2.431 |
| 2008 | 2.434 | 2.466 | 2.701 | 2.865 | 3.177 | 3.511 | 3.479 | 3.203 | 3.061 | 2.383 | 1.532 | 1.169 |
| 2009 | 1.289 | 1.433 | 1.450 | 1.544 | 1.768 | 2.087 | 1.977 | 2.102 | 2.090 | 2.007 | 2.104 | 2.062 |
| 2010 | 2.151 | 2.099 | 2.237 | 2.322 | 2.262 | 2.202 | 2.229 | 2.249 | 2.174 | 2.265 | 2.314 | 2.410 |
| 2011 | 2.491 | 2.611 | 2.959 | 3.181 | 3.208 | 3.047 | 3.006 | 2.979 | 3.040 | 2.937 | 2.832 | 2.689 |
| 2012 | 2.756 | 2.935 | 3.231 | 3.284 | 3.272 | 2.956 | 2.773 | 3.045 | 3.195 | 3.100 | 2.760 | 2.598 |
| 2013 | 2.599 | 2.938 | 3.042 | 2.873 | 2.945 | 2.879 | 2.981 | 2.906 | 2.798 | 2.616 | 2.505 | 2.541 |
| 2014 | 2.570 | 2.634 | 2.831 | 3.001 | 3.059 | 3.132 | 3.062 | 2.969 | 2.824 | 2.424 | 2.217 | 1.802 |
| 2015 | 1.439 | 1.671 | 1.949 | 1.942 | 2.244 | 2.271 | 2.279 | 2.066 | 1.768 | 1.590 | 1.549 | 1.489 |
| 2016 | 1.296 | 1.103 | 1.329 | 1.459 | 1.604 | 1.658 | 1.604 | 1.529 | 1.620 | 1.648 | 1.520 | 1.560 |
| 2017 | 1.663 | 1.679 | 1.766 | 1.831 | 1.781 | 1.704 | 1.709 | 1.803 | 1.923 | 1.792 | 1.899 | 1.815 |
| 2018 | 1.888 | 1.934 | 2.051 | 2.232 | 2.385 | 2.340 | 2.288 | 2.235 | 2.271 | 2.358 | 2.115 | 1.880 |
| 2019 | 1.728 | 1.733 | 1.954 | 2.320 | 2.389 | 2.141 | 2.118 | 2.007 | 2.044 | 2.203 | 2.082 | 1.932 |
| 2020 | 1.886 | 1.879 | 1.511 | 0.930 | 1.189 | 1.467 | 1.558 | 1.571 | 1.530 | 1.471 | 1.498 | 1.551 |
| 2021 | 1.703 | 1.889 | 2.169 | 2.255 | 2.383 | 2.448 | 2.572 | 2.650 | 2.546 | 2.658 | 2.692 | 2.565 |
| 2022 | 2.738 | 2.852 | 3.555 | |||||||||
| - = No Data Reported; -- = Not Applicable; NA = Not Available; W = Withheld to avoid disclosure of individual company data. |
| Release Date: 6/1/2022 |
| Next Release Date: TBD |
Referring Pages: