|
Download Data (XLS File) |
|
||||||||
|
||||||||
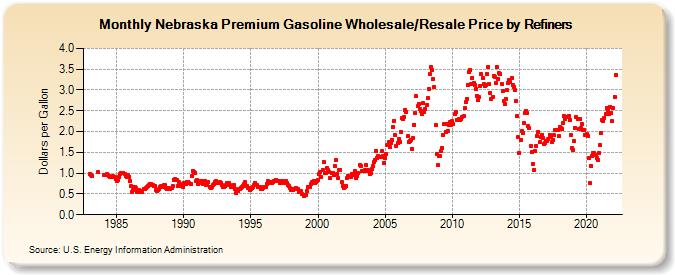
| Nebraska Premium Gasoline Wholesale/Resale Price by Refiners (Dollars per Gallon) | ||||||||
| Year | Jan | Feb | Mar | Apr | May | Jun | Jul | Aug | Sep | Oct | Nov | Dec |
|---|---|---|---|---|---|---|---|---|---|---|---|---|
| 1983 | 0.980 | 0.951 | 0.932 | W | W | W | W | 1.019 | W | W | W | W |
| 1984 | W | 0.953 | W | 0.970 | 0.944 | 0.942 | 0.915 | 0.908 | 0.919 | 0.923 | 0.909 | 0.863 |
| 1985 | 0.817 | 0.845 | 0.912 | 0.971 | 0.993 | 1.005 | 1.008 | 0.989 | 0.922 | 0.901 | 0.944 | 0.917 |
| 1986 | 0.816 | 0.682 | 0.557 | 0.587 | 0.673 | 0.637 | 0.549 | 0.585 | 0.594 | 0.553 | 0.562 | 0.548 |
| 1987 | 0.615 | 0.617 | 0.637 | 0.667 | 0.679 | 0.711 | 0.740 | 0.748 | 0.707 | 0.696 | 0.697 | 0.603 |
| 1988 | 0.580 | 0.598 | 0.607 | 0.668 | 0.682 | 0.670 | 0.705 | 0.708 | 0.645 | 0.626 | 0.647 | 0.609 |
| 1989 | 0.624 | 0.641 | 0.690 | 0.842 | 0.852 | 0.843 | 0.834 | 0.697 | 0.778 | 0.732 | 0.692 | 0.673 |
| 1990 | 0.771 | 0.738 | 0.728 | 0.780 | 0.790 | 0.768 | 0.738 | 0.939 | 1.058 | 1.035 | 1.003 | 0.811 |
| 1991 | 0.827 | 0.737 | 0.769 | 0.821 | 0.807 | 0.747 | 0.783 | 0.802 | 0.721 | 0.750 | 0.782 | 0.675 |
| 1992 | 0.637 | 0.673 | 0.710 | 0.741 | 0.790 | 0.804 | 0.754 | 0.755 | 0.782 | 0.765 | 0.708 | 0.661 |
| 1993 | 0.673 | 0.684 | 0.725 | 0.758 | 0.766 | 0.721 | 0.671 | 0.684 | 0.678 | 0.721 | 0.630 | 0.519 |
| 1994 | 0.576 | 0.612 | 0.622 | 0.651 | 0.665 | 0.696 | 0.740 | 0.786 | 0.688 | 0.644 | 0.632 | 0.592 |
| 1995 | 0.623 | 0.640 | 0.660 | 0.726 | 0.768 | 0.704 | 0.658 | 0.669 | 0.674 | 0.608 | 0.624 | 0.632 |
| 1996 | 0.655 | 0.673 | 0.745 | 0.804 | 0.788 | 0.786 | 0.759 | 0.767 | 0.784 | 0.799 | 0.843 | 0.800 |
| 1997 | 0.806 | 0.799 | 0.768 | W | 0.806 | 0.771 | 0.753 | 0.816 | 0.770 | 0.715 | 0.694 | 0.643 |
| 1998 | 0.601 | 0.607 | 0.599 | 0.620 | 0.645 | 0.621 | 0.611 | 0.556 | 0.560 | 0.564 | 0.498 | 0.441 |
| 1999 | 0.480 | 0.484 | 0.580 | 0.669 | 0.658 | 0.656 | 0.728 | 0.779 | 0.811 | 0.758 | 0.792 | 0.802 |
| 2000 | 0.843 | 0.982 | 1.039 | 0.905 | 1.074 | 1.279 | 1.013 | 1.012 | 1.120 | 1.075 | 1.038 | 0.888 |
| 2001 | 1.011 | 0.997 | 0.949 | 1.164 | 1.314 | 0.979 | 0.872 | 1.065 | 1.080 | 0.782 | 0.687 | 0.651 |
| 2002 | 0.676 | 0.693 | 0.886 | 0.940 | 0.915 | 0.914 | 0.978 | 0.952 | 0.978 | 1.043 | 0.880 | 0.927 |
| 2003 | 1.002 | 1.186 | 1.166 | 1.050 | 1.060 | 1.041 | 1.078 | 1.199 | 1.054 | 1.065 | 0.978 | 0.996 |
| 2004 | 1.103 | 1.167 | 1.258 | 1.318 | 1.537 | 1.373 | 1.418 | 1.380 | 1.398 | 1.523 | 1.424 | 1.249 |
| 2005 | 1.371 | 1.453 | 1.676 | 1.744 | 1.617 | 1.723 | 1.803 | 2.105 | 2.261 | 1.922 | 1.646 | 1.714 |
| 2006 | 1.824 | 1.746 | 1.999 | 2.314 | 2.297 | 2.360 | 2.524 | 2.470 | 1.894 | 1.758 | 1.775 | 1.800 |
| 2007 | 1.590 | 1.838 | 2.165 | 2.443 | 2.843 | 2.608 | 2.667 | 2.538 | 2.491 | 2.431 | 2.676 | 2.475 |
| 2008 | 2.534 | 2.638 | 2.805 | 3.029 | 3.375 | 3.542 | 3.472 | 3.269 | 3.064 | 2.155 | 1.469 | 1.188 |
| 2009 | 1.410 | 1.418 | 1.538 | 1.601 | 1.928 | 2.181 | 1.995 | 2.178 | 2.024 | 2.165 | 2.222 | 2.169 |
| 2010 | 2.246 | 2.191 | 2.412 | 2.480 | 2.280 | 2.283 | 2.293 | 2.267 | 2.291 | 2.356 | 2.367 | 2.555 |
| 2011 | 2.699 | 2.794 | 3.126 | 3.439 | 3.470 | 3.137 | 3.299 | 3.176 | 3.121 | 3.023 | 2.862 | 2.749 |
| 2012 | 2.820 | 3.107 | 3.378 | 3.293 | 3.140 | 3.089 | 3.129 | 3.394 | 3.562 | 3.153 | 2.929 | 2.791 |
| 2013 | 2.831 | 3.346 | 3.319 | 3.165 | 3.561 | 3.266 | 3.398 | 3.386 | 3.136 | 2.966 | 2.733 | 2.672 |
| 2014 | 2.785 | 2.992 | 3.179 | 3.239 | 3.192 | 3.284 | 3.112 | 3.082 | 2.995 | 2.735 | 2.368 | 1.861 |
| 2015 | 1.487 | 1.802 | 2.011 | 1.955 | 2.194 | 2.458 | 2.500 | 2.448 | 2.130 | 2.082 | 1.649 | 1.500 |
| 2016 | 1.223 | 1.085 | 1.529 | 1.658 | 1.890 | 1.982 | 1.742 | 1.869 | 1.916 | 1.855 | 1.692 | 1.727 |
| 2017 | 1.783 | 1.770 | 1.813 | 1.919 | 1.864 | 1.740 | 1.806 | 1.910 | 2.026 | 2.049 | 2.036 | 1.892 |
| 2018 | 2.108 | 2.077 | 2.070 | 2.205 | 2.385 | 2.304 | 2.344 | 2.343 | 2.380 | 2.275 | 1.923 | 1.596 |
| 2019 | 1.557 | 1.761 | 2.096 | 2.343 | 2.298 | 2.056 | 2.294 | 2.080 | 2.170 | 2.047 | 2.035 | 1.911 |
| 2020 | 1.935 | 1.891 | 1.364 | 0.756 | 1.170 | 1.415 | 1.496 | 1.473 | 1.435 | 1.358 | 1.326 | 1.487 |
| 2021 | 1.669 | 1.974 | 2.279 | 2.250 | 2.337 | 2.418 | 2.574 | 2.517 | 2.426 | 2.591 | 2.444 | 2.246 |
| 2022 | 2.563 | 2.841 | 3.356 | |||||||||
| - = No Data Reported; -- = Not Applicable; NA = Not Available; W = Withheld to avoid disclosure of individual company data. |
| Release Date: 6/1/2022 |
| Next Release Date: TBD |