|
Download Data (XLS File) |
|
||||||||
|
||||||||
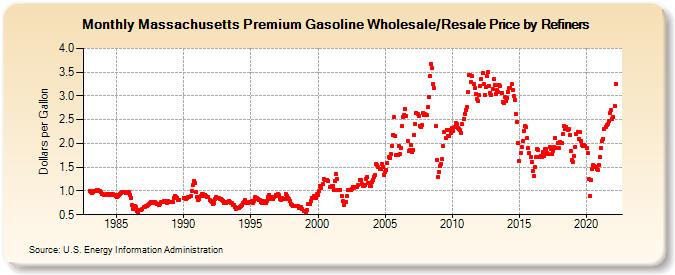
| Massachusetts Premium Gasoline Wholesale/Resale Price by Refiners (Dollars per Gallon) | ||||||||
| Year | Jan | Feb | Mar | Apr | May | Jun | Jul | Aug | Sep | Oct | Nov | Dec |
|---|---|---|---|---|---|---|---|---|---|---|---|---|
| 1983 | 1.009 | 0.978 | 0.948 | 0.971 | 1.004 | 1.007 | 1.021 | 1.015 | 1.009 | 0.991 | 0.969 | 0.935 |
| 1984 | 0.926 | 0.922 | 0.924 | 0.938 | 0.939 | 0.927 | 0.911 | 0.912 | 0.929 | 0.930 | 0.923 | 0.895 |
| 1985 | 0.876 | 0.885 | 0.916 | 0.946 | 0.967 | 0.973 | 0.988 | 0.968 | 0.950 | 0.965 | 0.967 | 0.968 |
| 1986 | 0.924 | 0.854 | 0.705 | 0.614 | 0.677 | 0.661 | 0.572 | 0.566 | 0.598 | 0.599 | 0.607 | 0.613 |
| 1987 | 0.655 | 0.666 | 0.674 | 0.691 | 0.706 | 0.727 | 0.750 | 0.774 | 0.744 | 0.759 | 0.768 | 0.747 |
| 1988 | 0.720 | 0.723 | 0.695 | 0.734 | 0.767 | 0.768 | 0.789 | 0.785 | 0.762 | 0.754 | 0.787 | 0.763 |
| 1989 | 0.761 | 0.768 | 0.777 | 0.859 | 0.896 | 0.880 | 0.852 | 0.812 | 0.816 | W | W | W |
| 1990 | 0.861 | W | 0.839 | 0.860 | 0.875 | 0.875 | 0.897 | 1.008 | 1.116 | 1.202 | 1.167 | 0.985 |
| 1991 | 0.881 | 0.807 | 0.828 | 0.884 | 0.939 | 0.927 | 0.894 | 0.919 | 0.894 | 0.875 | 0.879 | 0.801 |
| 1992 | 0.791 | 0.774 | 0.732 | 0.744 | 0.824 | 0.873 | 0.847 | 0.848 | 0.835 | 0.829 | 0.811 | 0.789 |
| 1993 | 0.750 | 0.760 | 0.757 | 0.763 | 0.793 | 0.766 | 0.756 | 0.738 | 0.714 | 0.713 | 0.662 | 0.623 |
| 1994 | 0.635 | 0.635 | 0.665 | 0.677 | 0.708 | 0.739 | 0.769 | 0.803 | 0.745 | 0.751 | 0.771 | 0.764 |
| 1995 | 0.764 | 0.782 | 0.747 | 0.797 | 0.867 | 0.861 | 0.832 | 0.807 | 0.807 | 0.772 | 0.741 | 0.783 |
| 1996 | 0.773 | 0.737 | 0.788 | 0.871 | 0.923 | 0.840 | 0.867 | 0.849 | 0.840 | 0.874 | 0.913 | 0.892 |
| 1997 | 0.932 | 0.907 | 0.836 | 0.810 | 0.850 | 0.841 | 0.839 | 0.932 | 0.896 | 0.855 | 0.827 | 0.791 |
| 1998 | 0.730 | 0.711 | 0.673 | 0.674 | 0.693 | 0.688 | 0.673 | 0.633 | 0.642 | 0.660 | 0.618 | 0.571 |
| 1999 | 0.575 | 0.558 | 0.607 | 0.721 | 0.720 | 0.725 | 0.793 | 0.843 | 0.894 | 0.855 | 0.853 | 0.935 |
| 2000 | 0.923 | 0.996 | 1.104 | 1.059 | 1.142 | 1.260 | 1.232 | 1.225 | 1.236 | 1.206 | NA | 1.084 |
| 2001 | 1.102 | 1.102 | 1.025 | 1.200 | 1.354 | 1.261 | 1.026 | 1.029 | 1.027 | 0.898 | 0.788 | 0.709 |
| 2002 | 0.760 | 0.768 | 0.887 | 1.017 | 1.028 | 1.014 | 1.045 | 1.081 | 1.071 | 1.084 | 1.079 | 1.076 |
| 2003 | 1.122 | 1.233 | 1.239 | 1.153 | 1.104 | 1.103 | 1.123 | 1.258 | 1.292 | 1.175 | 1.112 | 1.095 |
| 2004 | 1.188 | 1.241 | 1.299 | 1.329 | 1.572 | 1.546 | 1.499 | 1.470 | 1.466 | 1.575 | 1.507 | 1.339 |
| 2005 | 1.405 | 1.448 | 1.595 | 1.724 | 1.688 | 1.774 | 1.953 | 2.183 | 2.552 | 2.153 | 1.755 | 1.765 |
| 2006 | 1.949 | 1.785 | 1.905 | 2.363 | 2.557 | 2.599 | 2.729 | 2.578 | 2.060 | 1.832 | 1.852 | 1.965 |
| 2007 | 1.814 | 1.866 | 2.186 | 2.405 | 2.650 | 2.612 | 2.568 | 2.366 | 2.351 | 2.379 | 2.649 | 2.605 |
| 2008 | 2.619 | 2.608 | 2.760 | 2.981 | 3.417 | 3.682 | 3.588 | 3.241 | 3.164 | 2.357 | 1.652 | 1.290 |
| 2009 | 1.403 | 1.525 | 1.574 | 1.662 | 1.950 | 2.233 | 2.118 | 2.286 | 2.158 | 2.164 | 2.281 | 2.228 |
| 2010 | 2.323 | 2.260 | 2.354 | 2.438 | 2.406 | 2.333 | 2.307 | 2.280 | 2.223 | 2.401 | 2.524 | 2.624 |
| 2011 | 2.694 | 2.775 | 3.076 | 3.433 | 3.439 | 3.287 | 3.409 | 3.246 | 3.159 | 3.046 | 2.943 | 2.883 |
| 2012 | 3.016 | 3.204 | 3.363 | 3.474 | 3.255 | 3.018 | 3.191 | 3.409 | 3.497 | 3.214 | 3.058 | 3.021 |
| 2013 | 3.138 | 3.347 | 3.235 | 3.044 | 3.116 | 3.085 | 3.236 | 3.201 | 3.059 | 2.882 | 2.860 | 2.972 |
| 2014 | 2.884 | 2.961 | 3.073 | 3.170 | 3.176 | 3.251 | 3.132 | 2.991 | 2.917 | 2.623 | 2.448 | 2.008 |
| 2015 | 1.620 | 1.792 | 1.921 | 2.056 | 2.271 | 2.365 | 2.344 | 2.108 | 1.908 | 1.795 | 1.724 | 1.605 |
| 2016 | 1.429 | 1.316 | 1.495 | 1.716 | 1.887 | 1.872 | 1.725 | 1.737 | 1.721 | 1.820 | 1.745 | 1.873 |
| 2017 | 1.878 | 1.801 | 1.768 | 1.928 | 1.884 | 1.777 | 1.849 | 1.926 | 2.118 | 1.909 | 2.003 | 1.898 |
| 2018 | 2.029 | 2.002 | 2.014 | 2.192 | 2.371 | 2.307 | 2.344 | 2.288 | 2.296 | 2.186 | 1.836 | 1.650 |
| 2019 | 1.619 | 1.729 | 1.934 | 2.195 | 2.250 | 2.090 | 2.232 | 2.047 | 1.977 | 1.946 | 1.960 | 1.944 |
| 2020 | 1.908 | 1.795 | 1.253 | 0.890 | 1.222 | 1.458 | 1.540 | 1.528 | 1.494 | 1.454 | 1.435 | 1.551 |
| 2021 | 1.712 | 1.909 | 2.053 | 2.102 | 2.312 | 2.348 | 2.387 | 2.404 | 2.468 | 2.645 | 2.714 | 2.511 |
| 2022 | 2.548 | 2.790 | 3.253 | |||||||||
| - = No Data Reported; -- = Not Applicable; NA = Not Available; W = Withheld to avoid disclosure of individual company data. |
| Release Date: 6/1/2022 |
| Next Release Date: TBD |