|
Download Data (XLS File) |
|
||||||||
|
||||||||
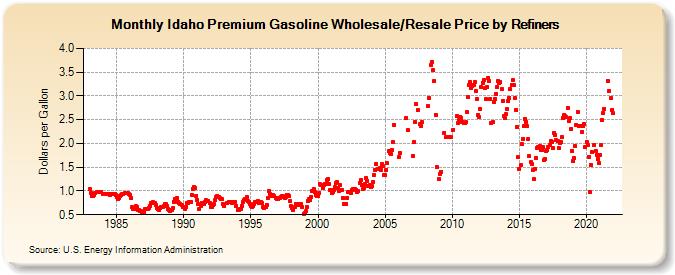
| Idaho Premium Gasoline Wholesale/Resale Price by Refiners (Dollars per Gallon) | ||||||||
| Year | Jan | Feb | Mar | Apr | May | Jun | Jul | Aug | Sep | Oct | Nov | Dec |
|---|---|---|---|---|---|---|---|---|---|---|---|---|
| 1983 | 1.039 | 0.954 | 0.895 | 0.893 | 0.924 | 0.957 | 0.969 | 0.972 | 0.980 | 0.983 | 0.978 | W |
| 1984 | 0.942 | 0.937 | W | 0.937 | 0.943 | 0.936 | 0.923 | 0.931 | 0.935 | 0.934 | 0.931 | 0.914 |
| 1985 | 0.867 | 0.831 | 0.848 | 0.894 | 0.918 | 0.935 | 0.939 | 0.950 | W | W | 0.950 | 0.940 |
| 1986 | 0.925 | 0.847 | 0.653 | 0.616 | 0.619 | 0.678 | 0.661 | 0.602 | 0.600 | 0.579 | 0.571 | 0.557 |
| 1987 | 0.561 | 0.611 | 0.624 | 0.624 | 0.621 | 0.638 | 0.687 | 0.736 | 0.763 | 0.750 | 0.748 | 0.694 |
| 1988 | 0.645 | 0.621 | 0.606 | 0.639 | 0.663 | 0.666 | 0.680 | 0.724 | 0.718 | 0.674 | 0.627 | 0.595 |
| 1989 | 0.579 | 0.607 | 0.632 | 0.778 | 0.830 | 0.841 | 0.852 | 0.777 | 0.736 | 0.735 | 0.714 | 0.672 |
| 1990 | 0.657 | 0.628 | 0.672 | 0.737 | 0.746 | 0.762 | 0.773 | 0.923 | 1.050 | 1.092 | 1.060 | 0.900 |
| 1991 | 0.815 | 0.725 | 0.626 | 0.687 | 0.755 | 0.736 | 0.717 | 0.775 | 0.800 | 0.782 | 0.792 | 0.746 |
| 1992 | 0.669 | 0.667 | 0.695 | 0.735 | 0.804 | 0.866 | 0.895 | 0.873 | 0.847 | 0.837 | 0.822 | 0.728 |
| 1993 | 0.683 | W | W | 0.746 | 0.763 | 0.770 | 0.761 | 0.751 | 0.763 | 0.774 | 0.767 | 0.687 |
| 1994 | 0.598 | 0.606 | 0.616 | 0.617 | 0.692 | 0.778 | 0.814 | 0.838 | 0.864 | 0.796 | 0.771 | 0.733 |
| 1995 | 0.690 | 0.672 | 0.682 | 0.734 | 0.758 | 0.774 | 0.786 | 0.757 | 0.766 | 0.768 | 0.745 | 0.666 |
| 1996 | 0.648 | 0.663 | 0.712 | 0.854 | 1.006 | 0.936 | 0.891 | 0.904 | 0.911 | 0.892 | 0.859 | 0.831 |
| 1997 | 0.840 | 0.853 | 0.852 | 0.882 | 0.891 | 0.890 | 0.859 | 0.879 | 0.916 | 0.919 | 0.887 | 0.790 |
| 1998 | 0.674 | 0.642 | 0.604 | 0.660 | 0.727 | 0.718 | 0.711 | 0.712 | 0.723 | 0.718 | 0.665 | 0.521 |
| 1999 | 0.537 | 0.571 | 0.652 | 0.788 | 0.831 | 0.818 | 0.882 | 1.002 | 1.036 | 0.978 | 0.917 | 0.899 |
| 2000 | 0.890 | 0.955 | 1.136 | 1.118 | 1.067 | 1.119 | 1.149 | 1.143 | 1.224 | 1.249 | 1.144 | 1.027 |
| 2001 | 0.957 | 0.983 | 1.028 | 1.081 | 1.172 | 1.178 | 1.059 | 1.005 | 1.117 | 1.028 | 0.861 | 0.726 |
| 2002 | 0.729 | 0.728 | 0.852 | 0.973 | 0.972 | 0.965 | 1.012 | 1.043 | 1.040 | 1.039 | 1.026 | 0.978 |
| 2003 | 0.992 | 1.163 | 1.221 | 1.124 | 1.034 | 1.065 | 1.140 | 1.263 | 1.218 | 1.108 | 1.123 | 1.083 |
| 2004 | 1.107 | 1.198 | 1.341 | 1.444 | 1.574 | W | 1.463 | 1.476 | 1.451 | 1.570 | 1.526 | 1.333 |
| 2005 | 1.333 | 1.447 | 1.581 | 1.834 | 1.792 | 1.772 | 1.867 | 2.029 | 2.394 | W | W | W |
| 2006 | 1.713 | 1.796 | W | W | W | W | W | 2.545 | 2.282 | W | W | W |
| 2007 | W | 1.745 | 2.038 | 2.449 | 2.820 | 2.701 | W | 2.407 | 2.375 | 2.444 | W | W |
| 2008 | W | W | 2.782 | 2.956 | W | 3.654 | 3.724 | 3.538 | 3.317 | 2.608 | 1.496 | W |
| 2009 | 1.248 | 1.360 | 1.401 | W | W | 2.227 | 2.125 | W | W | 2.140 | W | 2.135 |
| 2010 | W | 2.288 | W | W | 2.570 | 2.428 | 2.487 | 2.565 | 2.538 | 2.460 | 2.430 | 2.423 |
| 2011 | 2.444 | 2.661 | 2.981 | 3.228 | 3.292 | 3.175 | 3.207 | 3.239 | 3.302 | 3.101 | 2.943 | 2.603 |
| 2012 | 2.560 | 2.734 | 3.191 | 3.277 | 3.335 | 3.158 | 2.931 | 3.190 | 3.386 | 3.310 | 2.940 | 2.437 |
| 2013 | 2.446 | 2.881 | 2.941 | 3.036 | 3.181 | 3.319 | 3.262 | 3.288 | 3.141 | 2.887 | 2.572 | 2.526 |
| 2014 | 2.614 | 2.724 | 2.887 | 2.958 | 3.145 | 3.240 | 3.334 | 3.234 | 2.960 | 2.714 | 2.356 | 1.710 |
| 2015 | 1.462 | 1.536 | 1.983 | 2.094 | 2.358 | 2.515 | 2.460 | 2.357 | 2.097 | 1.735 | 1.603 | 1.566 |
| 2016 | 1.433 | 1.247 | 1.466 | 1.692 | 1.914 | 1.921 | 1.938 | 1.857 | 1.852 | 1.915 | 1.646 | 1.679 |
| 2017 | 1.831 | 1.870 | 1.918 | 1.965 | 2.043 | 2.034 | 1.897 | 2.229 | 2.184 | 2.067 | 2.041 | 1.902 |
| 2018 | 2.008 | 2.033 | 2.127 | 2.538 | 2.601 | 2.584 | 2.550 | 2.747 | 2.464 | 2.534 | 2.310 | 1.848 |
| 2019 | 1.631 | 1.684 | 1.943 | 2.384 | 2.667 | 2.358 | 2.376 | 2.371 | 2.248 | 2.357 | 2.408 | 1.930 |
| 2020 | 2.036 | 1.973 | 1.725 | 0.971 | 1.544 | 1.817 | W | 1.966 | 1.843 | 1.747 | 1.682 | 1.580 |
| 2021 | 1.761 | 1.964 | 2.492 | 2.645 | 2.723 | W | W | 3.321 | 3.109 | W | 2.948 | 2.714 |
| 2022 | 2.634 | W | W | |||||||||
| - = No Data Reported; -- = Not Applicable; NA = Not Available; W = Withheld to avoid disclosure of individual company data. |
| Release Date: 6/1/2022 |
| Next Release Date: TBD |