|
Download Data (XLS File) |
|
||||||||
|
||||||||
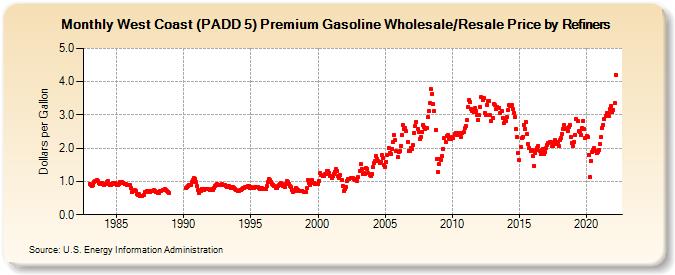
| West Coast (PADD 5) Premium Gasoline Wholesale/Resale Price by Refiners (Dollars per Gallon) | ||||||||
| Year | Jan | Feb | Mar | Apr | May | Jun | Jul | Aug | Sep | Oct | Nov | Dec |
|---|---|---|---|---|---|---|---|---|---|---|---|---|
| 1983 | 0.937 | 0.886 | 0.864 | 0.904 | 0.982 | 1.018 | 1.035 | 1.007 | 0.960 | 0.921 | 0.932 | 0.946 |
| 1984 | 0.926 | 0.894 | 0.923 | 0.983 | 0.999 | 0.936 | 0.887 | 0.885 | 0.917 | 0.957 | 0.956 | 0.917 |
| 1985 | 0.886 | 0.886 | 0.928 | 0.982 | 0.997 | 0.988 | 0.948 | 0.917 | 0.922 | 0.905 | 0.892 | 0.905 |
| 1986 | 0.885 | 0.815 | 0.693 | 0.698 | 0.729 | 0.702 | 0.620 | 0.602 | 0.611 | 0.551 | 0.555 | 0.549 |
| 1987 | 0.606 | 0.682 | 0.695 | 0.712 | 0.720 | 0.708 | 0.697 | 0.721 | 0.724 | 0.729 | 0.708 | 0.686 |
| 1988 | 0.673 | 0.657 | 0.659 | 0.714 | 0.724 | 0.738 | 0.754 | 0.761 | 0.755 | 0.712 | 0.685 | 0.659 |
| 1989 | W | W | W | W | W | W | W | W | W | W | W | W |
| 1990 | W | W | 0.802 | 0.820 | 0.865 | 0.898 | 0.904 | 0.973 | 1.036 | 1.095 | 1.082 | 0.971 |
| 1991 | 0.858 | 0.752 | 0.664 | 0.701 | 0.785 | 0.776 | 0.739 | 0.767 | 0.787 | 0.771 | 0.764 | 0.742 |
| 1992 | 0.739 | 0.762 | 0.757 | 0.800 | 0.870 | 0.900 | 0.913 | 0.903 | 0.896 | 0.907 | 0.916 | 0.879 |
| 1993 | 0.889 | 0.886 | 0.860 | 0.844 | 0.855 | 0.844 | 0.816 | 0.813 | 0.822 | 0.817 | 0.772 | 0.730 |
| 1994 | 0.714 | 0.722 | 0.731 | 0.748 | 0.762 | 0.791 | 0.817 | 0.829 | 0.832 | 0.850 | 0.849 | 0.815 |
| 1995 | 0.823 | 0.804 | 0.791 | 0.812 | 0.845 | 0.843 | 0.821 | 0.795 | 0.785 | 0.804 | 0.793 | 0.785 |
| 1996 | 0.785 | 0.783 | 0.856 | 0.987 | 1.062 | 1.031 | 0.995 | 0.936 | 0.897 | 0.856 | 0.798 | 0.805 |
| 1997 | 0.857 | 0.883 | 0.918 | 0.954 | 0.910 | 0.869 | 0.826 | 0.922 | 0.999 | 0.973 | 0.923 | 0.870 |
| 1998 | 0.824 | 0.740 | 0.685 | 0.726 | 0.796 | 0.765 | 0.743 | 0.722 | 0.722 | 0.719 | 0.716 | 0.694 |
| 1999 | 0.686 | 0.681 | 0.806 | 1.038 | 0.954 | 0.906 | 0.981 | 1.029 | 0.955 | 0.933 | 0.924 | 0.933 |
| 2000 | 0.935 | 1.017 | 1.241 | 1.183 | 1.149 | 1.169 | 1.223 | 1.222 | 1.326 | 1.304 | 1.256 | 1.156 |
| 2001 | 1.102 | 1.168 | 1.213 | 1.298 | 1.382 | 1.319 | 1.156 | 1.092 | 1.185 | 1.037 | 0.870 | 0.723 |
| 2002 | 0.770 | 0.832 | 1.007 | 1.087 | 1.060 | 1.102 | 1.094 | 1.096 | 1.083 | 1.054 | 1.073 | 1.024 |
| 2003 | 1.122 | 1.318 | 1.511 | 1.386 | 1.230 | 1.253 | 1.214 | 1.400 | 1.387 | 1.252 | 1.206 | 1.151 |
| 2004 | 1.227 | 1.420 | 1.545 | 1.605 | 1.751 | 1.685 | 1.620 | 1.562 | 1.599 | 1.785 | 1.705 | 1.488 |
| 2005 | 1.443 | 1.597 | 1.790 | 2.009 | 1.864 | 1.833 | 1.986 | 2.172 | 2.402 | 2.233 | 1.901 | 1.723 |
| 2006 | 1.887 | 1.915 | 2.056 | 2.399 | 2.691 | 2.575 | 2.603 | 2.507 | 2.191 | 1.928 | 1.924 | 2.010 |
| 2007 | 1.970 | 2.094 | 2.457 | 2.680 | 2.793 | 2.589 | 2.485 | 2.280 | 2.338 | 2.486 | 2.710 | 2.631 |
| 2008 | 2.570 | 2.619 | 2.924 | 3.124 | 3.346 | 3.777 | 3.639 | 3.324 | 3.106 | 2.557 | 1.671 | 1.289 |
| 2009 | 1.513 | 1.688 | 1.654 | 1.760 | 1.970 | 2.309 | 2.197 | 2.362 | 2.384 | 2.295 | 2.276 | 2.277 |
| 2010 | 2.322 | 2.301 | 2.430 | 2.464 | 2.401 | 2.432 | 2.464 | 2.447 | 2.329 | 2.445 | 2.480 | 2.596 |
| 2011 | 2.667 | 2.849 | 3.241 | 3.462 | 3.377 | 3.170 | 3.131 | 3.080 | 3.199 | 3.129 | 3.007 | 2.858 |
| 2012 | 2.989 | 3.246 | 3.524 | 3.441 | 3.495 | 3.065 | 3.001 | 3.307 | 3.409 | 3.420 | 2.983 | 2.814 |
| 2013 | 2.915 | 3.343 | 3.288 | 3.170 | 3.249 | 3.202 | 3.215 | 3.061 | 3.115 | 2.913 | 2.771 | 2.810 |
| 2014 | 2.803 | 2.926 | 3.135 | 3.313 | 3.261 | 3.304 | 3.179 | 3.067 | 2.925 | 2.568 | 2.326 | 1.870 |
| 2015 | 1.643 | 2.042 | 2.293 | 2.330 | 2.705 | 2.591 | 2.793 | 2.424 | 2.112 | 2.013 | 1.919 | 1.936 |
| 2016 | 1.752 | 1.472 | 1.844 | 1.937 | 1.995 | 2.063 | 1.926 | 1.815 | 1.951 | 1.982 | 1.812 | 1.882 |
| 2017 | 1.997 | 2.099 | 2.143 | 2.186 | 2.178 | 2.062 | 2.066 | 2.164 | 2.243 | 2.121 | 2.182 | 2.072 |
| 2018 | 2.240 | 2.296 | 2.434 | 2.579 | 2.696 | 2.610 | 2.586 | 2.529 | 2.629 | 2.708 | 2.342 | 2.153 |
| 2019 | 2.080 | 2.200 | 2.407 | 2.877 | 2.831 | 2.504 | 2.493 | 2.395 | 2.600 | 2.825 | 2.562 | 2.308 |
| 2020 | 2.371 | 2.344 | 1.800 | 1.125 | 1.618 | 1.884 | 1.949 | 1.991 | 1.930 | 1.865 | 1.886 | 1.940 |
| 2021 | 2.128 | 2.341 | 2.618 | 2.705 | 2.868 | 2.982 | 3.061 | 3.046 | 2.972 | 3.184 | 3.267 | 3.084 |
| 2022 | 3.158 | 3.351 | 4.203 | |||||||||
| - = No Data Reported; -- = Not Applicable; NA = Not Available; W = Withheld to avoid disclosure of individual company data. |
| Release Date: 6/1/2022 |
| Next Release Date: TBD |