|
Download Data (XLS File) |
|
||||||||
|
||||||||
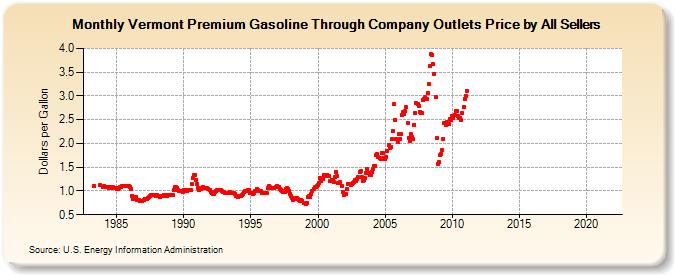
| Vermont Premium Gasoline Through Company Outlets Price by All Sellers (Dollars per Gallon) | ||||||||
| Year | Jan | Feb | Mar | Apr | May | Jun | Jul | Aug | Sep | Oct | Nov | Dec |
|---|---|---|---|---|---|---|---|---|---|---|---|---|
| 1983 | W | W | W | W | 1.106 | W | W | W | W | 1.118 | W | W |
| 1984 | 1.089 | 1.096 | 1.084 | 1.091 | 1.091 | 1.071 | 1.076 | 1.060 | 1.073 | 1.073 | 1.068 | 1.058 |
| 1985 | 1.038 | 1.039 | 1.063 | 1.074 | 1.092 | 1.096 | 1.104 | 1.096 | 1.107 | 1.095 | 1.099 | 1.107 |
| 1986 | 1.086 | 1.037 | 0.903 | 0.824 | 0.873 | 0.870 | 0.808 | 0.804 | 0.805 | 0.788 | 0.782 | 0.791 |
| 1987 | 0.818 | 0.839 | 0.840 | 0.836 | 0.842 | 0.876 | 0.900 | 0.922 | 0.914 | 0.911 | 0.920 | 0.898 |
| 1988 | 0.905 | 0.896 | 0.885 | 0.881 | 0.888 | 0.896 | 0.916 | 0.917 | 0.901 | 0.903 | 0.915 | 0.910 |
| 1989 | 0.912 | 0.912 | 0.911 | 1.016 | 1.073 | 1.080 | 1.071 | 1.020 | 1.007 | 1.008 | 0.996 | 0.981 |
| 1990 | 1.024 | 1.020 | 1.004 | 0.995 | 1.011 | 1.024 | 1.029 | 1.151 | 1.274 | 1.338 | 1.340 | 1.234 |
| 1991 | 1.154 | 1.067 | 1.028 | 1.043 | 1.066 | 1.074 | 1.056 | 1.070 | 1.065 | 1.053 | 1.048 | 1.020 |
| 1992 | 0.982 | 0.965 | 0.937 | 0.946 | 0.981 | 1.001 | 1.024 | 1.021 | 1.018 | 1.015 | 1.005 | 0.988 |
| 1993 | 0.973 | 0.960 | 0.948 | 0.949 | 0.962 | 0.970 | 0.963 | 0.957 | 0.964 | 0.951 | 0.932 | 0.885 |
| 1994 | 0.879 | 0.890 | 0.892 | 0.894 | 0.909 | 0.937 | 0.977 | 0.989 | 1.001 | 1.014 | 1.013 | 0.962 |
| 1995 | 0.956 | 0.948 | 0.940 | 0.950 | 1.005 | 1.047 | 1.017 | 1.002 | 1.001 | 0.996 | 0.953 | 0.957 |
| 1996 | 0.958 | 0.952 | 0.962 | 1.056 | 1.094 | 1.075 | 1.070 | 1.060 | 1.059 | 1.060 | 1.081 | 1.099 |
| 1997 | 1.092 | 1.091 | 1.051 | 1.010 | 0.993 | 0.987 | 0.976 | 1.038 | 1.055 | 1.031 | 0.995 | 0.938 |
| 1998 | 0.904 | 0.859 | 0.815 | 0.828 | 0.846 | 0.846 | 0.837 | 0.815 | 0.799 | 0.815 | 0.796 | 0.746 |
| 1999 | 0.748 | 0.721 | 0.757 | 0.873 | 0.889 | 0.883 | 0.938 | 1.002 | 1.045 | 1.074 | 1.076 | 1.104 |
| 2000 | 1.119 | 1.173 | 1.280 | 1.209 | 1.254 | 1.341 | 1.316 | 1.313 | 1.338 | 1.321 | 1.315 | 1.219 |
| 2001 | 1.233 | 1.235 | 1.195 | 1.286 | 1.399 | 1.307 | 1.169 | 1.161 | 1.180 | 1.096 | 0.982 | 0.909 |
| 2002 | 0.927 | 0.933 | 1.039 | 1.144 | 1.141 | 1.126 | 1.148 | 1.174 | 1.182 | 1.225 | 1.216 | 1.243 |
| 2003 | 1.285 | 1.396 | 1.414 | 1.298 | 1.213 | 1.234 | 1.265 | 1.376 | 1.462 | 1.386 | 1.328 | 1.334 |
| 2004 | 1.401 | 1.460 | 1.524 | 1.533 | 1.754 | 1.773 | 1.706 | 1.695 | 1.674 | 1.800 | 1.807 | 1.688 |
| 2005 | 1.674 | 1.719 | 1.837 | 1.976 | 1.901 | 1.934 | 2.085 | 2.267 | 2.823 | 2.492 | 2.086 | 2.035 |
| 2006 | 2.191 | 2.101 | 2.199 | 2.598 | 2.661 | 2.615 | 2.674 | 2.759 | 2.435 | 2.116 | 2.049 | 2.200 |
| 2007 | 2.134 | 2.094 | 2.394 | 2.634 | 2.841 | 2.826 | 2.791 | 2.667 | 2.635 | 2.649 | 2.922 | 2.932 |
| 2008 | 2.968 | 2.940 | 3.069 | 3.243 | 3.639 | 3.876 | 3.871 | 3.664 | 3.471 | 2.978 | 2.118 | 1.573 |
| 2009 | 1.602 | 1.755 | 1.778 | 1.859 | 2.102 | 2.422 | 2.391 | 2.442 | 2.418 | 2.400 | 2.511 | 2.487 |
| 2010 | 2.576 | 2.532 | 2.607 | 2.685 | 2.675 | 2.573 | 2.544 | 2.528 | 2.486 | 2.632 | 2.764 | 2.926 |
| 2011 | 3.001 | 3.108 | - | - | - | - | - | - | - | - | - | - |
| 2012 | - | - | - | - | - | - | - | - | - | - | - | - |
| 2013 | - | - | - | - | - | - | - | - | - | - | - | - |
| 2014 | - | - | - | - | - | - | - | - | - | - | - | - |
| 2015 | - | - | - | - | - | - | - | - | - | - | - | - |
| 2016 | - | - | - | - | - | - | - | - | - | - | - | - |
| 2017 | - | - | - | - | - | - | - | - | - | - | - | - |
| 2018 | - | - | - | - | - | - | - | - | - | - | - | - |
| 2019 | - | - | - | - | - | - | - | - | - | - | - | - |
| 2020 | - | - | - | - | - | - | - | - | - | - | - | - |
| 2021 | - | - | - | - | - | - | - | - | - | - | - | - |
| 2022 | - | - | - | |||||||||
| - = No Data Reported; -- = Not Applicable; NA = Not Available; W = Withheld to avoid disclosure of individual company data. |
| Release Date: 6/1/2022 |
| Next Release Date: TBD |