|
Download Data (XLS File) |
|
||||||||
|
||||||||
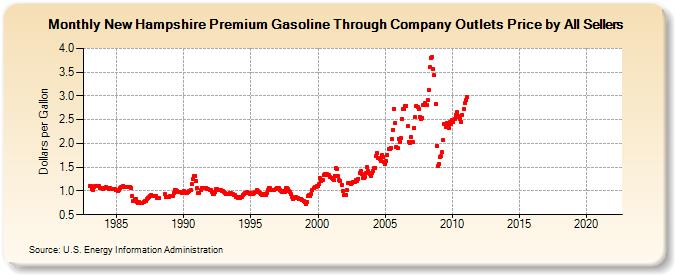
| New Hampshire Premium Gasoline Through Company Outlets Price by All Sellers (Dollars per Gallon) | ||||||||
| Year | Jan | Feb | Mar | Apr | May | Jun | Jul | Aug | Sep | Oct | Nov | Dec |
|---|---|---|---|---|---|---|---|---|---|---|---|---|
| 1983 | 1.110 | 1.099 | 1.034 | 1.028 | 1.080 | 1.101 | 1.108 | 1.103 | 1.094 | 1.072 | 1.068 | 1.059 |
| 1984 | 1.041 | 1.067 | 1.075 | 1.059 | 1.066 | 1.050 | 1.052 | 1.043 | 1.039 | 1.040 | 1.034 | 1.024 |
| 1985 | 1.012 | 1.009 | 1.030 | 1.060 | 1.074 | 1.090 | 1.109 | 1.092 | 1.086 | 1.088 | 1.088 | 1.091 |
| 1986 | 1.083 | 1.055 | 0.898 | 0.799 | 0.833 | 0.840 | 0.762 | 0.748 | 0.770 | 0.738 | NA | 0.747 |
| 1987 | 0.778 | 0.790 | 0.795 | 0.829 | 0.849 | 0.872 | 0.904 | 0.914 | 0.900 | 0.895 | 0.896 | 0.898 |
| 1988 | 0.862 | 0.861 | 0.860 | NA | NA | NA | NA | 0.930 | 0.876 | 0.870 | 0.873 | 0.877 |
| 1989 | 0.884 | 0.884 | 0.885 | 0.960 | 1.024 | 1.025 | 0.999 | 0.972 | 0.974 | 0.971 | 0.962 | 0.957 |
| 1990 | 0.989 | 0.976 | 0.969 | 0.962 | 0.985 | 0.998 | 1.012 | 1.136 | 1.246 | 1.321 | 1.322 | 1.203 |
| 1991 | 1.062 | 0.964 | 0.953 | 1.014 | 1.066 | 1.070 | 1.059 | 1.064 | 1.064 | 1.047 | 1.046 | 1.029 |
| 1992 | 1.015 | 0.970 | 0.945 | 0.946 | 0.982 | 1.032 | 1.036 | 1.023 | 1.020 | 1.013 | 1.007 | 0.994 |
| 1993 | 0.978 | 0.964 | 0.946 | 0.929 | 0.943 | 0.952 | 0.949 | 0.941 | 0.926 | 0.924 | 0.910 | 0.881 |
| 1994 | 0.860 | 0.866 | 0.857 | 0.871 | 0.882 | 0.909 | 0.933 | 0.964 | 0.970 | 0.959 | 0.961 | 0.945 |
| 1995 | 0.959 | 0.944 | 0.933 | 0.950 | 0.988 | 1.011 | 0.997 | 0.976 | 0.967 | 0.941 | 0.914 | 0.917 |
| 1996 | 0.926 | 0.923 | 0.949 | 1.020 | 1.069 | 1.058 | 1.025 | 1.017 | 1.017 | 1.021 | 1.045 | 1.072 |
| 1997 | 1.070 | 1.057 | 1.022 | 1.001 | 0.988 | 0.991 | 0.983 | 1.065 | 1.064 | 1.031 | 0.998 | 0.970 |
| 1998 | 0.930 | 0.882 | 0.837 | 0.842 | 0.865 | 0.861 | 0.849 | 0.827 | 0.822 | 0.835 | 0.819 | 0.785 |
| 1999 | 0.767 | 0.734 | 0.768 | 0.890 | 0.917 | 0.894 | 0.941 | 1.011 | 1.054 | 1.080 | 1.082 | 1.102 |
| 2000 | 1.111 | 1.151 | 1.264 | 1.212 | 1.228 | 1.337 | 1.359 | 1.335 | 1.351 | 1.334 | 1.329 | 1.289 |
| 2001 | 1.267 | 1.262 | 1.231 | 1.325 | 1.480 | 1.455 | 1.312 | 1.221 | 1.206 | 1.122 | 0.990 | 0.905 |
| 2002 | 0.918 | 0.925 | 1.027 | 1.164 | 1.171 | 1.151 | 1.161 | 1.196 | 1.191 | 1.198 | 1.220 | 1.218 |
| 2003 | 1.261 | 1.387 | 1.417 | 1.347 | 1.283 | 1.266 | 1.294 | 1.388 | 1.496 | 1.418 | 1.347 | 1.306 |
| 2004 | 1.375 | 1.425 | 1.476 | 1.490 | 1.727 | 1.794 | 1.701 | 1.666 | 1.638 | 1.750 | 1.720 | 1.616 |
| 2005 | 1.574 | 1.625 | 1.760 | 1.892 | 1.885 | 1.914 | 2.089 | 2.289 | 2.733 | 2.440 | 1.935 | 1.909 |
| 2006 | 2.102 | 2.030 | 2.112 | 2.519 | 2.718 | 2.724 | 2.790 | 2.796 | 2.370 | 2.033 | 2.010 | 2.133 |
| 2007 | 2.031 | 2.021 | 2.335 | 2.546 | 2.797 | 2.775 | 2.735 | 2.563 | 2.516 | 2.544 | 2.806 | 2.815 |
| 2008 | 2.846 | 2.812 | 2.922 | 3.127 | 3.599 | 3.808 | 3.825 | 3.560 | 3.432 | 2.833 | 1.952 | 1.519 |
| 2009 | 1.570 | 1.715 | 1.727 | 1.813 | 2.073 | 2.406 | 2.347 | 2.435 | 2.401 | 2.335 | 2.444 | 2.418 |
| 2010 | 2.495 | 2.457 | 2.521 | 2.608 | 2.658 | 2.577 | 2.548 | 2.518 | 2.460 | 2.604 | 2.728 | 2.845 |
| 2011 | 2.906 | 2.977 | - | - | - | - | - | - | - | - | - | - |
| 2012 | - | - | - | - | - | - | - | - | - | - | - | - |
| 2013 | - | - | - | - | - | - | - | - | - | - | - | - |
| 2014 | - | - | - | - | - | - | - | - | - | - | - | - |
| 2015 | - | - | - | - | - | - | - | - | - | - | - | - |
| 2016 | - | - | - | - | - | - | - | - | - | - | - | - |
| 2017 | - | - | - | - | - | - | - | - | - | - | - | - |
| 2018 | - | - | - | - | - | - | - | - | - | - | - | - |
| 2019 | - | - | - | - | - | - | - | - | - | - | - | - |
| 2020 | - | - | - | - | - | - | - | - | - | - | - | - |
| 2021 | - | - | - | - | - | - | - | - | - | - | - | - |
| 2022 | - | - | - | |||||||||
| - = No Data Reported; -- = Not Applicable; NA = Not Available; W = Withheld to avoid disclosure of individual company data. |
| Release Date: 6/1/2022 |
| Next Release Date: TBD |