|
Download Data (XLS File) |
|
||||||||
|
||||||||
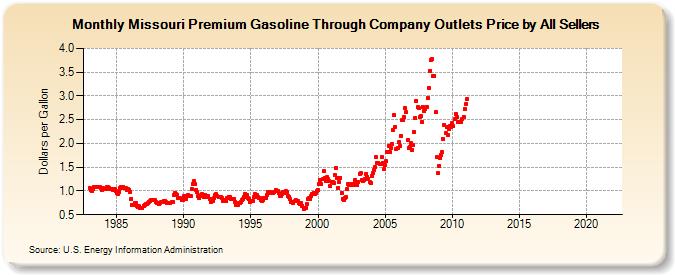
| Missouri Premium Gasoline Through Company Outlets Price by All Sellers (Dollars per Gallon) | ||||||||
| Year | Jan | Feb | Mar | Apr | May | Jun | Jul | Aug | Sep | Oct | Nov | Dec |
|---|---|---|---|---|---|---|---|---|---|---|---|---|
| 1983 | 1.056 | 1.021 | 1.003 | 1.037 | 1.089 | 1.087 | 1.086 | 1.087 | 1.087 | 1.081 | 1.056 | 1.029 |
| 1984 | 1.054 | 1.042 | 1.048 | 1.076 | 1.079 | 1.070 | 1.045 | 1.032 | 1.033 | 1.011 | 1.031 | 0.997 |
| 1985 | 0.956 | 0.945 | 0.971 | 1.066 | 1.074 | 1.068 | 1.085 | 1.059 | 1.054 | 1.024 | 1.041 | 1.027 |
| 1986 | 0.969 | 0.836 | 0.713 | 0.695 | 0.742 | 0.745 | 0.684 | 0.668 | 0.676 | 0.641 | 0.646 | 0.651 |
| 1987 | 0.690 | 0.708 | 0.720 | 0.734 | 0.748 | 0.778 | 0.798 | 0.816 | 0.802 | 0.805 | 0.801 | 0.778 |
| 1988 | 0.754 | 0.738 | 0.718 | 0.745 | 0.764 | 0.766 | 0.786 | 0.795 | 0.766 | 0.752 | 0.754 | 0.744 |
| 1989 | 0.746 | 0.758 | 0.765 | 0.924 | 0.964 | 0.932 | 0.910 | 0.857 | 0.856 | 0.842 | 0.820 | 0.807 |
| 1990 | 0.886 | 0.846 | 0.836 | 0.886 | 0.907 | 0.904 | 0.890 | 1.043 | 1.154 | 1.200 | 1.144 | 1.027 |
| 1991 | 0.977 | 0.885 | 0.859 | 0.907 | 0.930 | 0.895 | 0.876 | 0.917 | 0.875 | 0.866 | 0.891 | 0.838 |
| 1992 | 0.776 | 0.779 | 0.797 | 0.849 | 0.911 | 0.926 | 0.891 | 0.868 | 0.881 | 0.876 | 0.844 | 0.787 |
| 1993 | 0.799 | 0.807 | 0.785 | 0.851 | 0.881 | 0.868 | 0.836 | 0.827 | 0.821 | 0.832 | 0.775 | 0.710 |
| 1994 | 0.711 | 0.736 | 0.751 | 0.774 | 0.800 | 0.840 | 0.877 | 0.939 | 0.905 | 0.851 | 0.840 | 0.774 |
| 1995 | 0.788 | 0.785 | 0.798 | 0.868 | 0.927 | 0.915 | 0.870 | 0.856 | 0.854 | 0.808 | 0.784 | 0.810 |
| 1996 | 0.849 | 0.851 | 0.910 | 0.988 | 0.984 | 0.972 | 0.964 | 0.955 | 0.957 | 0.973 | 1.016 | 1.005 |
| 1997 | 0.996 | 0.949 | 0.901 | 0.898 | 0.942 | 0.980 | 0.950 | 0.997 | 0.977 | 0.894 | 0.875 | 0.821 |
| 1998 | 0.764 | 0.769 | 0.749 | 0.781 | 0.803 | 0.796 | 0.798 | 0.740 | 0.734 | 0.736 | 0.689 | 0.623 |
| 1999 | 0.649 | 0.638 | 0.718 | 0.831 | 0.845 | 0.834 | 0.893 | 0.942 | 0.967 | 0.941 | 0.963 | 0.999 |
| 2000 | 1.020 | 1.145 | 1.240 | 1.142 | 1.246 | 1.412 | 1.274 | 1.205 | 1.288 | 1.243 | 1.208 | 1.097 |
| 2001 | 1.197 | 1.195 | 1.159 | 1.342 | 1.488 | 1.269 | 1.059 | 1.182 | 1.273 | 0.964 | 0.841 | 0.809 |
| 2002 | 0.857 | 0.867 | 1.035 | 1.140 | 1.118 | 1.122 | 1.148 | 1.143 | 1.135 | 1.220 | 1.139 | 1.117 |
| 2003 | 1.198 | 1.367 | 1.372 | 1.235 | 1.206 | 1.229 | 1.252 | 1.367 | 1.294 | 1.250 | 1.190 | 1.160 |
| 2004 | 1.311 | 1.369 | 1.438 | 1.498 | 1.705 | 1.584 | 1.591 | 1.571 | 1.572 | 1.709 | 1.598 | 1.464 |
| 2005 | 1.550 | 1.625 | 1.828 | 1.955 | 1.823 | 1.908 | 1.998 | 2.290 | 2.603 | 2.354 | 1.877 | 1.913 |
| 2006 | 2.022 | 1.942 | 2.164 | 2.485 | 2.498 | 2.551 | 2.737 | 2.656 | 2.071 | 1.900 | 1.925 | 2.002 |
| 2007 | 1.863 | 1.963 | 2.249 | 2.531 | 2.903 | 2.758 | 2.745 | 2.564 | 2.567 | 2.460 | 2.765 | 2.680 |
| 2008 | 2.725 | 2.763 | 2.946 | 3.170 | 3.532 | 3.763 | 3.778 | 3.425 | 3.419 | 2.651 | 1.707 | 1.369 |
| 2009 | 1.530 | 1.683 | 1.757 | 1.813 | 2.090 | 2.394 | 2.219 | 2.338 | 2.170 | 2.297 | 2.377 | 2.355 |
| 2010 | 2.421 | 2.357 | 2.508 | 2.619 | 2.554 | 2.452 | 2.454 | 2.446 | 2.460 | 2.523 | 2.558 | 2.726 |
| 2011 | 2.822 | 2.926 | - | - | - | - | - | - | - | - | - | - |
| 2012 | - | - | - | - | - | - | - | - | - | - | - | - |
| 2013 | - | - | - | - | - | - | - | - | - | - | - | - |
| 2014 | - | - | - | - | - | - | - | - | - | - | - | - |
| 2015 | - | - | - | - | - | - | - | - | - | - | - | - |
| 2016 | - | - | - | - | - | - | - | - | - | - | - | - |
| 2017 | - | - | - | - | - | - | - | - | - | - | - | - |
| 2018 | - | - | - | - | - | - | - | - | - | - | - | - |
| 2019 | - | - | - | - | - | - | - | - | - | - | - | - |
| 2020 | - | - | - | - | - | - | - | - | - | - | - | - |
| 2021 | - | - | - | - | - | - | - | - | - | - | - | - |
| 2022 | - | - | - | |||||||||
| - = No Data Reported; -- = Not Applicable; NA = Not Available; W = Withheld to avoid disclosure of individual company data. |
| Release Date: 6/1/2022 |
| Next Release Date: TBD |