|
Download Data (XLS File) |
|
||||||||
|
||||||||
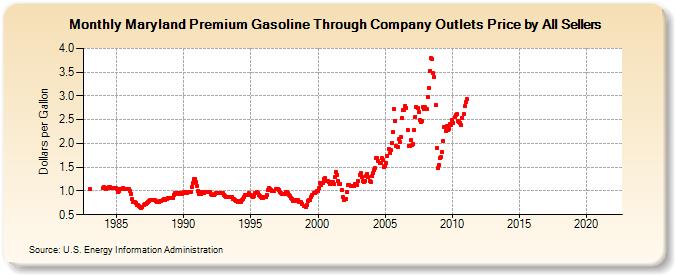
| Maryland Premium Gasoline Through Company Outlets Price by All Sellers (Dollars per Gallon) | ||||||||
| Year | Jan | Feb | Mar | Apr | May | Jun | Jul | Aug | Sep | Oct | Nov | Dec |
|---|---|---|---|---|---|---|---|---|---|---|---|---|
| 1983 | 1.045 | W | W | W | W | W | W | W | W | W | W | W |
| 1984 | 1.067 | 1.076 | 1.050 | 1.060 | 1.068 | 1.073 | 1.082 | 1.069 | 1.066 | 1.064 | 1.066 | 1.058 |
| 1985 | 1.042 | 0.982 | 0.995 | 1.048 | 1.043 | 1.043 | 1.061 | 1.039 | 1.038 | 1.037 | 1.043 | 1.037 |
| 1986 | 0.994 | 0.942 | 0.827 | 0.771 | 0.766 | 0.751 | 0.698 | 0.701 | 0.679 | 0.665 | 0.650 | 0.654 |
| 1987 | 0.709 | 0.721 | 0.734 | 0.747 | 0.766 | 0.788 | 0.802 | 0.803 | 0.804 | 0.803 | 0.801 | 0.787 |
| 1988 | 0.776 | 0.775 | 0.760 | 0.788 | 0.795 | 0.805 | 0.824 | 0.820 | 0.832 | 0.835 | 0.846 | 0.851 |
| 1989 | 0.856 | 0.849 | 0.853 | 0.921 | 0.958 | 0.965 | 0.962 | 0.943 | 0.956 | 0.950 | 0.945 | 0.956 |
| 1990 | 0.976 | 0.970 | 0.951 | 0.963 | 0.973 | 0.974 | 0.979 | 1.080 | 1.172 | 1.247 | 1.254 | 1.188 |
| 1991 | 1.094 | 1.000 | 0.934 | 0.937 | 0.986 | 0.977 | 0.959 | 0.981 | 0.979 | 0.970 | 0.988 | 0.980 |
| 1992 | 0.941 | 0.925 | 0.911 | 0.908 | 0.945 | 0.966 | 0.967 | 0.963 | 0.956 | 0.958 | 0.964 | 0.948 |
| 1993 | 0.924 | 0.894 | 0.880 | 0.863 | 0.881 | 0.881 | 0.875 | 0.864 | 0.835 | 0.826 | 0.820 | 0.795 |
| 1994 | 0.768 | 0.780 | 0.772 | 0.778 | 0.808 | 0.836 | 0.867 | 0.909 | 0.908 | 0.906 | 0.950 | 0.920 |
| 1995 | 0.906 | 0.896 | 0.867 | 0.896 | 0.967 | 0.976 | 0.947 | 0.915 | 0.896 | 0.871 | 0.850 | 0.857 |
| 1996 | 0.881 | 0.883 | 0.917 | 1.013 | 1.065 | 1.042 | 1.021 | 0.993 | 0.990 | 0.997 | 1.031 | 1.048 |
| 1997 | 1.044 | 1.021 | 0.981 | 0.953 | 0.946 | 0.935 | 0.933 | 0.975 | 0.982 | 0.950 | 0.917 | 0.889 |
| 1998 | 0.859 | 0.826 | 0.797 | 0.790 | 0.812 | 0.814 | 0.803 | 0.777 | 0.758 | 0.762 | 0.734 | 0.686 |
| 1999 | 0.685 | 0.666 | 0.711 | 0.793 | 0.810 | 0.812 | 0.869 | 0.916 | 0.955 | 0.960 | 0.973 | 0.991 |
| 2000 | 0.992 | 1.061 | 1.174 | 1.118 | 1.166 | 1.251 | 1.264 | 1.204 | 1.217 | 1.202 | 1.193 | 1.137 |
| 2001 | 1.180 | 1.190 | 1.153 | 1.293 | 1.402 | 1.344 | 1.210 | 1.146 | 1.148 | 1.016 | 0.872 | 0.812 |
| 2002 | 0.831 | 0.831 | 0.972 | 1.129 | 1.133 | 1.114 | 1.114 | 1.112 | 1.113 | 1.150 | 1.123 | 1.127 |
| 2003 | 1.204 | 1.342 | 1.371 | 1.295 | 1.200 | 1.188 | 1.216 | 1.307 | 1.359 | 1.285 | 1.218 | 1.192 |
| 2004 | 1.309 | 1.373 | 1.431 | 1.476 | 1.685 | 1.693 | 1.626 | 1.596 | 1.588 | 1.686 | 1.643 | 1.509 |
| 2005 | 1.522 | 1.588 | 1.736 | 1.893 | 1.798 | 1.861 | 2.012 | 2.244 | 2.728 | 2.466 | 1.940 | 1.925 |
| 2006 | 2.091 | 2.027 | 2.133 | 2.538 | 2.700 | 2.697 | 2.796 | 2.747 | 2.293 | 1.955 | 1.938 | 2.069 |
| 2007 | 1.972 | 1.982 | 2.283 | 2.563 | 2.764 | 2.746 | 2.671 | 2.502 | 2.446 | 2.476 | 2.767 | 2.724 |
| 2008 | 2.758 | 2.729 | 2.983 | 3.173 | 3.533 | 3.790 | 3.774 | 3.473 | 3.389 | 2.811 | 1.901 | 1.493 |
| 2009 | 1.543 | 1.685 | 1.724 | 1.820 | 2.052 | 2.344 | 2.267 | 2.363 | 2.290 | 2.302 | 2.413 | 2.389 |
| 2010 | 2.492 | 2.436 | 2.550 | 2.606 | 2.611 | 2.474 | 2.444 | 2.439 | 2.393 | 2.542 | 2.622 | 2.780 |
| 2011 | 2.873 | 2.925 | - | - | - | - | - | - | - | - | - | - |
| 2012 | - | - | - | - | - | - | - | - | - | - | - | - |
| 2013 | - | - | - | - | - | - | - | - | - | - | - | - |
| 2014 | - | - | - | - | - | - | - | - | - | - | - | - |
| 2015 | - | - | - | - | - | - | - | - | - | - | - | - |
| 2016 | - | - | - | - | - | - | - | - | - | - | - | - |
| 2017 | - | - | - | - | - | - | - | - | - | - | - | - |
| 2018 | - | - | - | - | - | - | - | - | - | - | - | - |
| 2019 | - | - | - | - | - | - | - | - | - | - | - | - |
| 2020 | - | - | - | - | - | - | - | - | - | - | - | - |
| 2021 | - | - | - | - | - | - | - | - | - | - | - | - |
| 2022 | - | - | - | |||||||||
| - = No Data Reported; -- = Not Applicable; NA = Not Available; W = Withheld to avoid disclosure of individual company data. |
| Release Date: 6/1/2022 |
| Next Release Date: TBD |