|
Download Data (XLS File) |
|
||||||||
|
||||||||
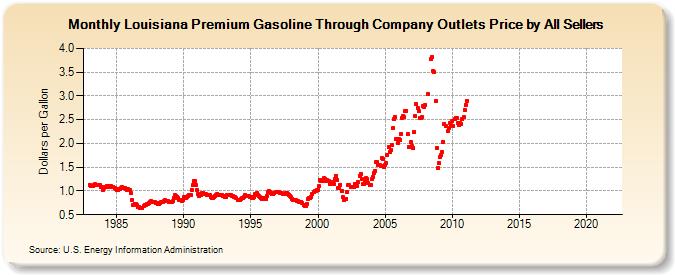
| Louisiana Premium Gasoline Through Company Outlets Price by All Sellers (Dollars per Gallon) | ||||||||
| Year | Jan | Feb | Mar | Apr | May | Jun | Jul | Aug | Sep | Oct | Nov | Dec |
|---|---|---|---|---|---|---|---|---|---|---|---|---|
| 1983 | 1.133 | 1.100 | 1.108 | 1.102 | 1.119 | 1.141 | 1.133 | 1.117 | 1.120 | 1.115 | 1.084 | 1.087 |
| 1984 | 1.027 | 1.070 | 1.085 | 1.098 | 1.099 | 1.092 | 1.096 | 1.094 | 1.083 | 1.075 | 1.060 | 1.048 |
| 1985 | 1.027 | 1.011 | 1.031 | 1.041 | 1.063 | 1.073 | 1.064 | 1.059 | 1.042 | 1.029 | 1.032 | 1.025 |
| 1986 | 1.014 | 0.950 | 0.808 | 0.710 | 0.733 | 0.735 | 0.707 | 0.665 | 0.671 | 0.633 | 0.638 | 0.647 |
| 1987 | 0.673 | 0.714 | 0.714 | 0.717 | 0.721 | 0.748 | 0.762 | 0.784 | 0.765 | 0.759 | 0.760 | 0.744 |
| 1988 | 0.739 | 0.716 | 0.718 | 0.745 | 0.763 | 0.764 | 0.785 | 0.804 | 0.790 | 0.790 | 0.780 | 0.766 |
| 1989 | 0.771 | 0.763 | 0.784 | 0.852 | 0.905 | 0.896 | 0.880 | 0.858 | 0.809 | 0.814 | 0.792 | 0.801 |
| 1990 | 0.863 | 0.864 | 0.860 | 0.879 | 0.893 | 0.920 | 0.916 | 1.026 | 1.121 | 1.212 | 1.210 | 1.124 |
| 1991 | 1.021 | 0.944 | 0.885 | 0.913 | 0.954 | 0.953 | 0.936 | 0.945 | 0.926 | 0.918 | 0.920 | 0.905 |
| 1992 | 0.877 | 0.857 | 0.852 | 0.874 | 0.904 | 0.923 | 0.939 | 0.922 | 0.923 | 0.919 | 0.916 | 0.901 |
| 1993 | 0.890 | 0.874 | 0.882 | 0.912 | 0.916 | 0.912 | 0.908 | 0.904 | 0.898 | 0.882 | 0.869 | 0.845 |
| 1994 | 0.817 | 0.802 | 0.815 | 0.827 | 0.845 | 0.856 | 0.881 | 0.908 | 0.904 | 0.886 | 0.892 | 0.876 |
| 1995 | 0.864 | 0.854 | 0.847 | 0.877 | 0.936 | 0.950 | 0.921 | 0.891 | 0.872 | 0.852 | 0.831 | 0.829 |
| 1996 | 0.844 | 0.840 | 0.890 | 0.971 | 0.995 | 0.975 | 0.955 | 0.940 | 0.937 | 0.947 | 0.972 | 0.983 |
| 1997 | 0.983 | 0.979 | 0.965 | 0.962 | 0.947 | 0.941 | 0.926 | 0.953 | 0.958 | 0.940 | 0.922 | 0.893 |
| 1998 | 0.865 | 0.835 | 0.810 | 0.802 | 0.804 | 0.799 | 0.797 | 0.778 | 0.770 | 0.769 | 0.747 | 0.699 |
| 1999 | 0.688 | 0.689 | 0.721 | 0.830 | 0.844 | 0.843 | 0.881 | 0.936 | 0.970 | 0.990 | 0.995 | 1.019 |
| 2000 | 1.026 | 1.096 | 1.239 | 1.206 | 1.204 | 1.266 | 1.258 | 1.200 | 1.227 | 1.215 | 1.203 | 1.150 |
| 2001 | 1.177 | 1.193 | 1.148 | 1.257 | 1.325 | 1.231 | 1.069 | 1.072 | 1.135 | 0.997 | 0.868 | 0.801 |
| 2002 | 0.829 | 0.833 | 0.978 | 1.127 | 1.118 | 1.090 | 1.090 | 1.084 | 1.092 | 1.155 | 1.139 | 1.112 |
| 2003 | 1.182 | 1.325 | 1.358 | 1.251 | 1.136 | 1.148 | 1.192 | 1.276 | 1.248 | 1.162 | 1.124 | 1.125 |
| 2004 | 1.247 | 1.301 | 1.379 | 1.426 | 1.604 | 1.601 | 1.547 | 1.547 | 1.526 | 1.684 | 1.671 | 1.507 |
| 2005 | 1.552 | 1.578 | 1.761 | 1.918 | 1.827 | 1.854 | 1.970 | 2.316 | 2.508 | 2.547 | 2.087 | 2.012 |
| 2006 | 2.103 | 2.075 | 2.205 | 2.540 | 2.575 | 2.552 | 2.677 | 2.686 | 2.193 | 1.928 | 1.918 | 2.020 |
| 2007 | 1.937 | 1.905 | 2.244 | 2.573 | 2.820 | 2.756 | 2.673 | 2.544 | 2.544 | 2.548 | 2.785 | 2.774 |
| 2008 | 2.809 | NA | 3.039 | NA | NA | 3.767 | 3.819 | 3.527 | 3.505 | 2.893 | 1.912 | 1.492 |
| 2009 | 1.583 | 1.705 | 1.758 | 1.822 | 2.037 | 2.417 | 2.359 | NA | 2.257 | 2.330 | 2.421 | 2.381 |
| 2010 | 2.472 | 2.360 | 2.505 | 2.538 | 2.526 | 2.433 | 2.395 | 2.431 | 2.408 | 2.508 | 2.550 | 2.710 |
| 2011 | 2.814 | 2.903 | - | - | - | - | - | - | - | - | - | - |
| 2012 | - | - | - | - | - | - | - | - | - | - | - | - |
| 2013 | - | - | - | - | - | - | - | - | - | - | - | - |
| 2014 | - | - | - | - | - | - | - | - | - | - | - | - |
| 2015 | - | - | - | - | - | - | - | - | - | - | - | - |
| 2016 | - | - | - | - | - | - | - | - | - | - | - | - |
| 2017 | - | - | - | - | - | - | - | - | - | - | - | - |
| 2018 | - | - | - | - | - | - | - | - | - | - | - | - |
| 2019 | - | - | - | - | - | - | - | - | - | - | - | - |
| 2020 | - | - | - | - | - | - | - | - | - | - | - | - |
| 2021 | - | - | - | - | - | - | - | - | - | - | - | - |
| 2022 | - | - | - | |||||||||
| - = No Data Reported; -- = Not Applicable; NA = Not Available; W = Withheld to avoid disclosure of individual company data. |
| Release Date: 6/1/2022 |
| Next Release Date: TBD |